

Explore and charts
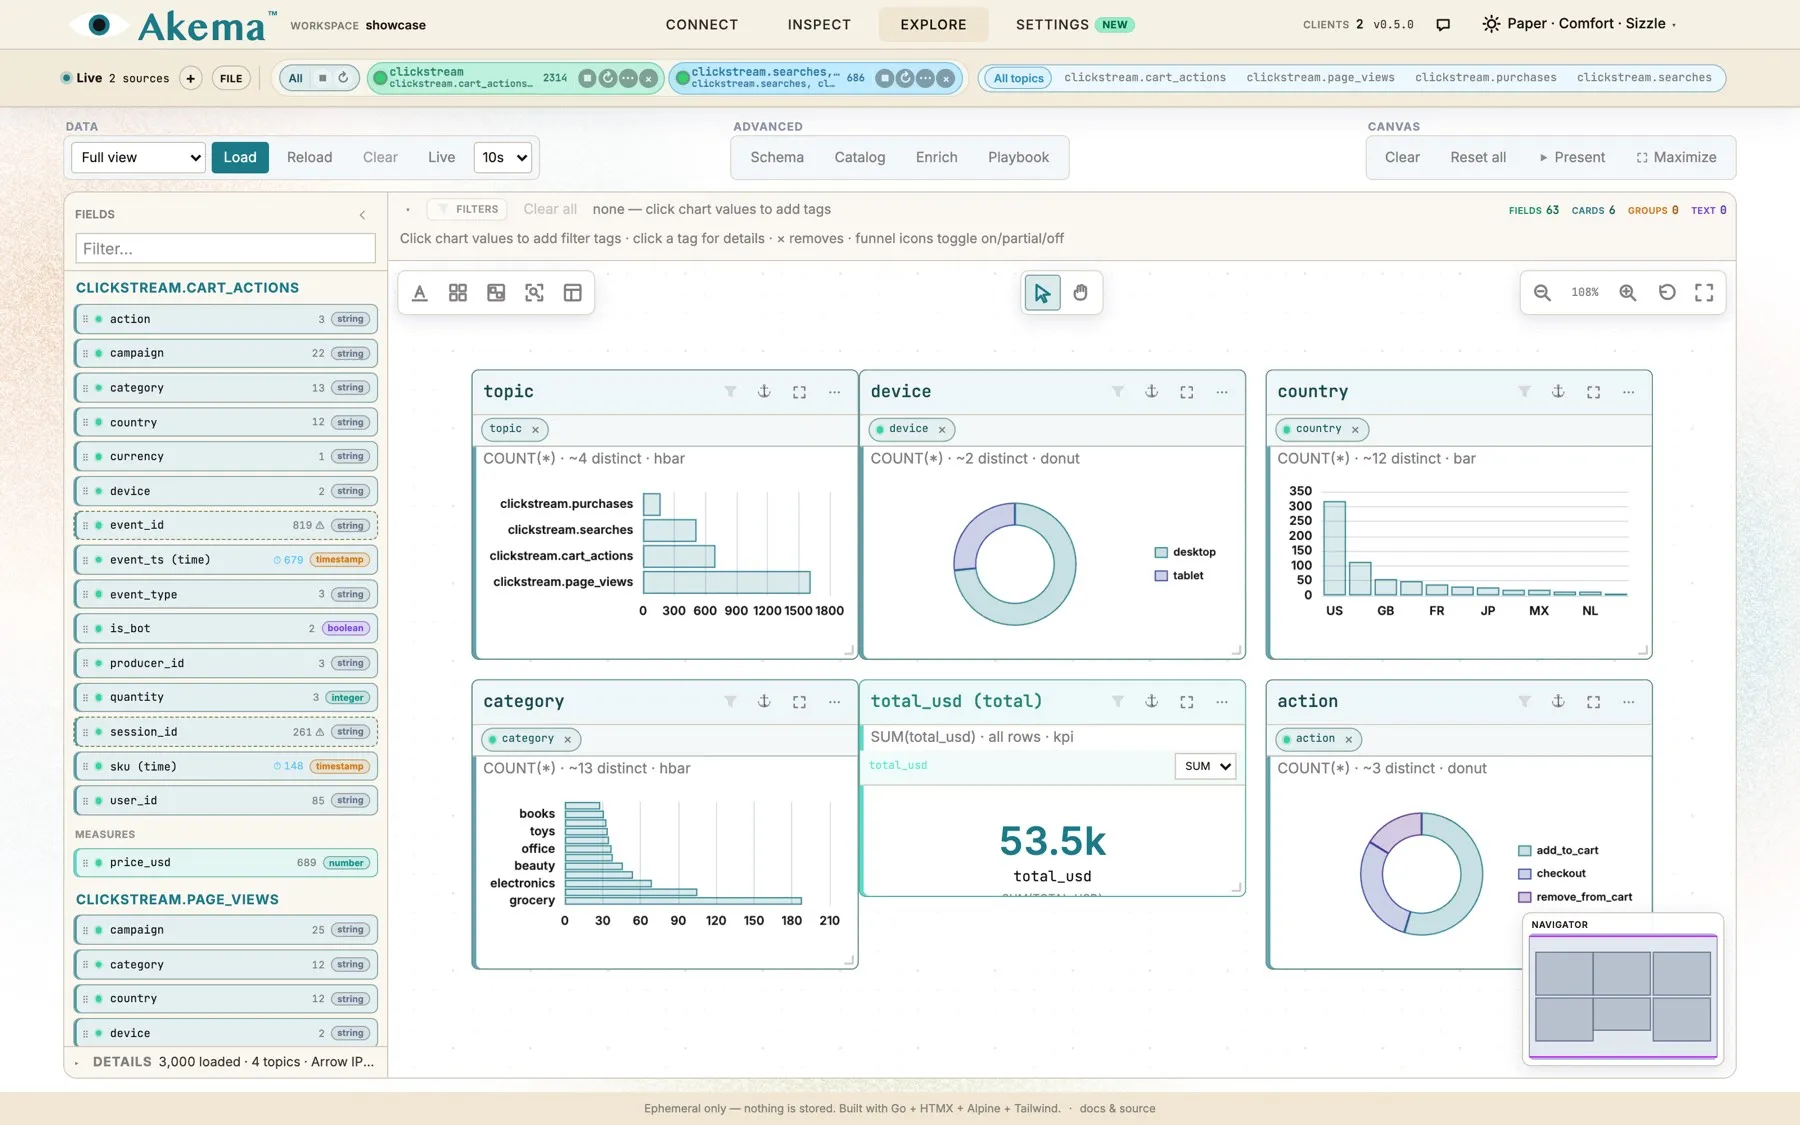
Explore turns a window of recent messages into charts you can build, filter and present. Drag a field onto the canvas and you get a chart; click a bar and every chart filters to it. Under the hood, Explore loads the messages into DuckDB, an analytics database that runs inside your browser tab, so queries are fast and the data never leaves your machine. There’s no warehouse to set up and nothing to clean up afterwards.
Load data
Section titled “Load data”Explore works on a snapshot. Choose Load to copy the messages Akema is holding into the browser’s database. The charts then stay still while you work, even on a busy topic.
| Control | What it does |
|---|---|
| Load | Takes a snapshot of the messages Akema is holding, from every source |
| Reload | Takes a fresh snapshot, keeping your charts, layout and filters |
| Clear | Empties the browser’s database. Charts and layout stay |
| Live | Reloads automatically every 5, 10, 15, 30 or 60 seconds, so the charts follow the stream. Off by default |
The menu next to Load chooses what goes into the snapshot:
- Full view: every message Akema is holding.
- Sample every N: 1 in every N messages, for a quick look at a large window.
- Trapped only: only messages that matched a trap.
Details, under the Fields palette, shows how many messages were loaded. Explore loads what Akema is still holding, by default the newest 10,000 messages per source, not everything it has ever received. To look further back, raise Explore rings in Settings.
Fields
Section titled “Fields”After a Load, the Fields palette lists everything Explore found in the messages, with how many distinct values each field has and its type:
- Payload: fields inside the message value, including nested ones such as
customer.country. With several topics loaded, fields are grouped by topic. - Measures: numbers you can add up or average, such as
total_usd. - Envelope: details of each message, such as its topic, partition, offset, key and time.
A ⚠ marks a field with so many distinct values, such as an ID, that a chart of it would be unreadable.
Schema
Section titled “Schema”Schema shows how Explore read each field, and lets you correct it:
- Type: change a field’s type, for example to timestamp for a time stored as text, or enum for a code. The types are string, integer, number, boolean, timestamp, enum, json and array.
- Role: make a field a Dimension (something to group by), a Measure (something to add up), or Ignore it to hide it from the palette.
Your corrections are kept and applied every time you load.
Build charts
Section titled “Build charts”| To get | Do this |
|---|---|
| A count of messages by a field | Drag the field onto the canvas |
| A sum, average, minimum or maximum | Drop a measure onto a chart, then choose SUM, AVG, MIN or MAX |
| A single headline number | Drag a measure onto empty canvas. You get a KPI card |
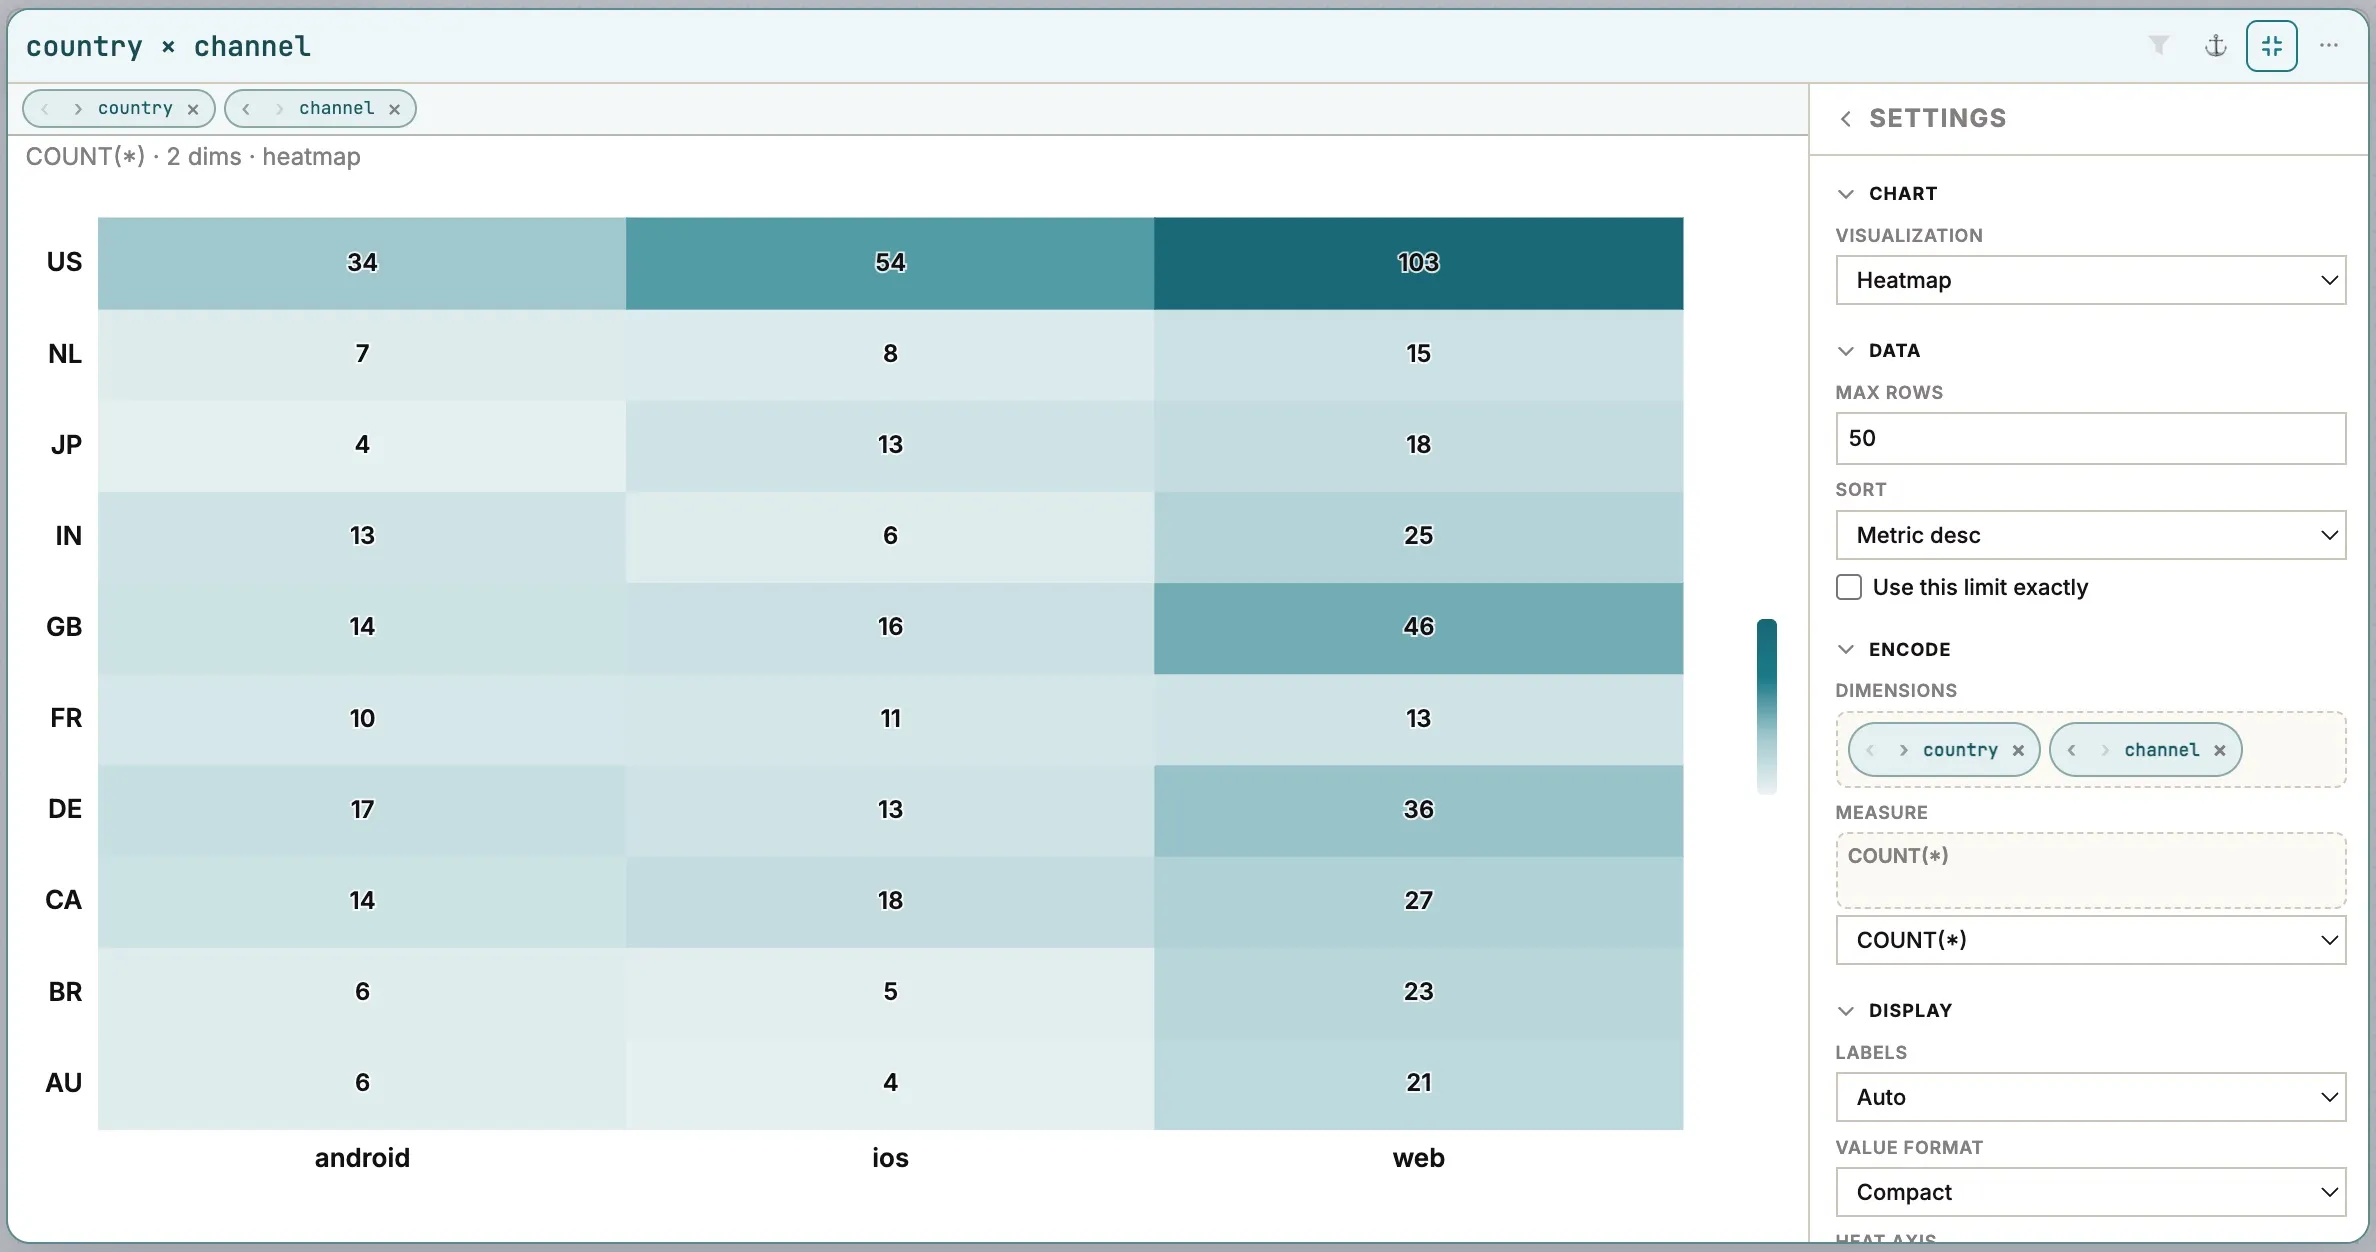
| A breakdown by two fields | Drop a second field onto a chart, then choose Stacked bar or Heatmap |
| Messages over time | Drag the time field, then choose a Line or Area chart |
Explore picks a sensible chart for each field. To change it, open the chart’s ⋯ menu and choose a Visualization.
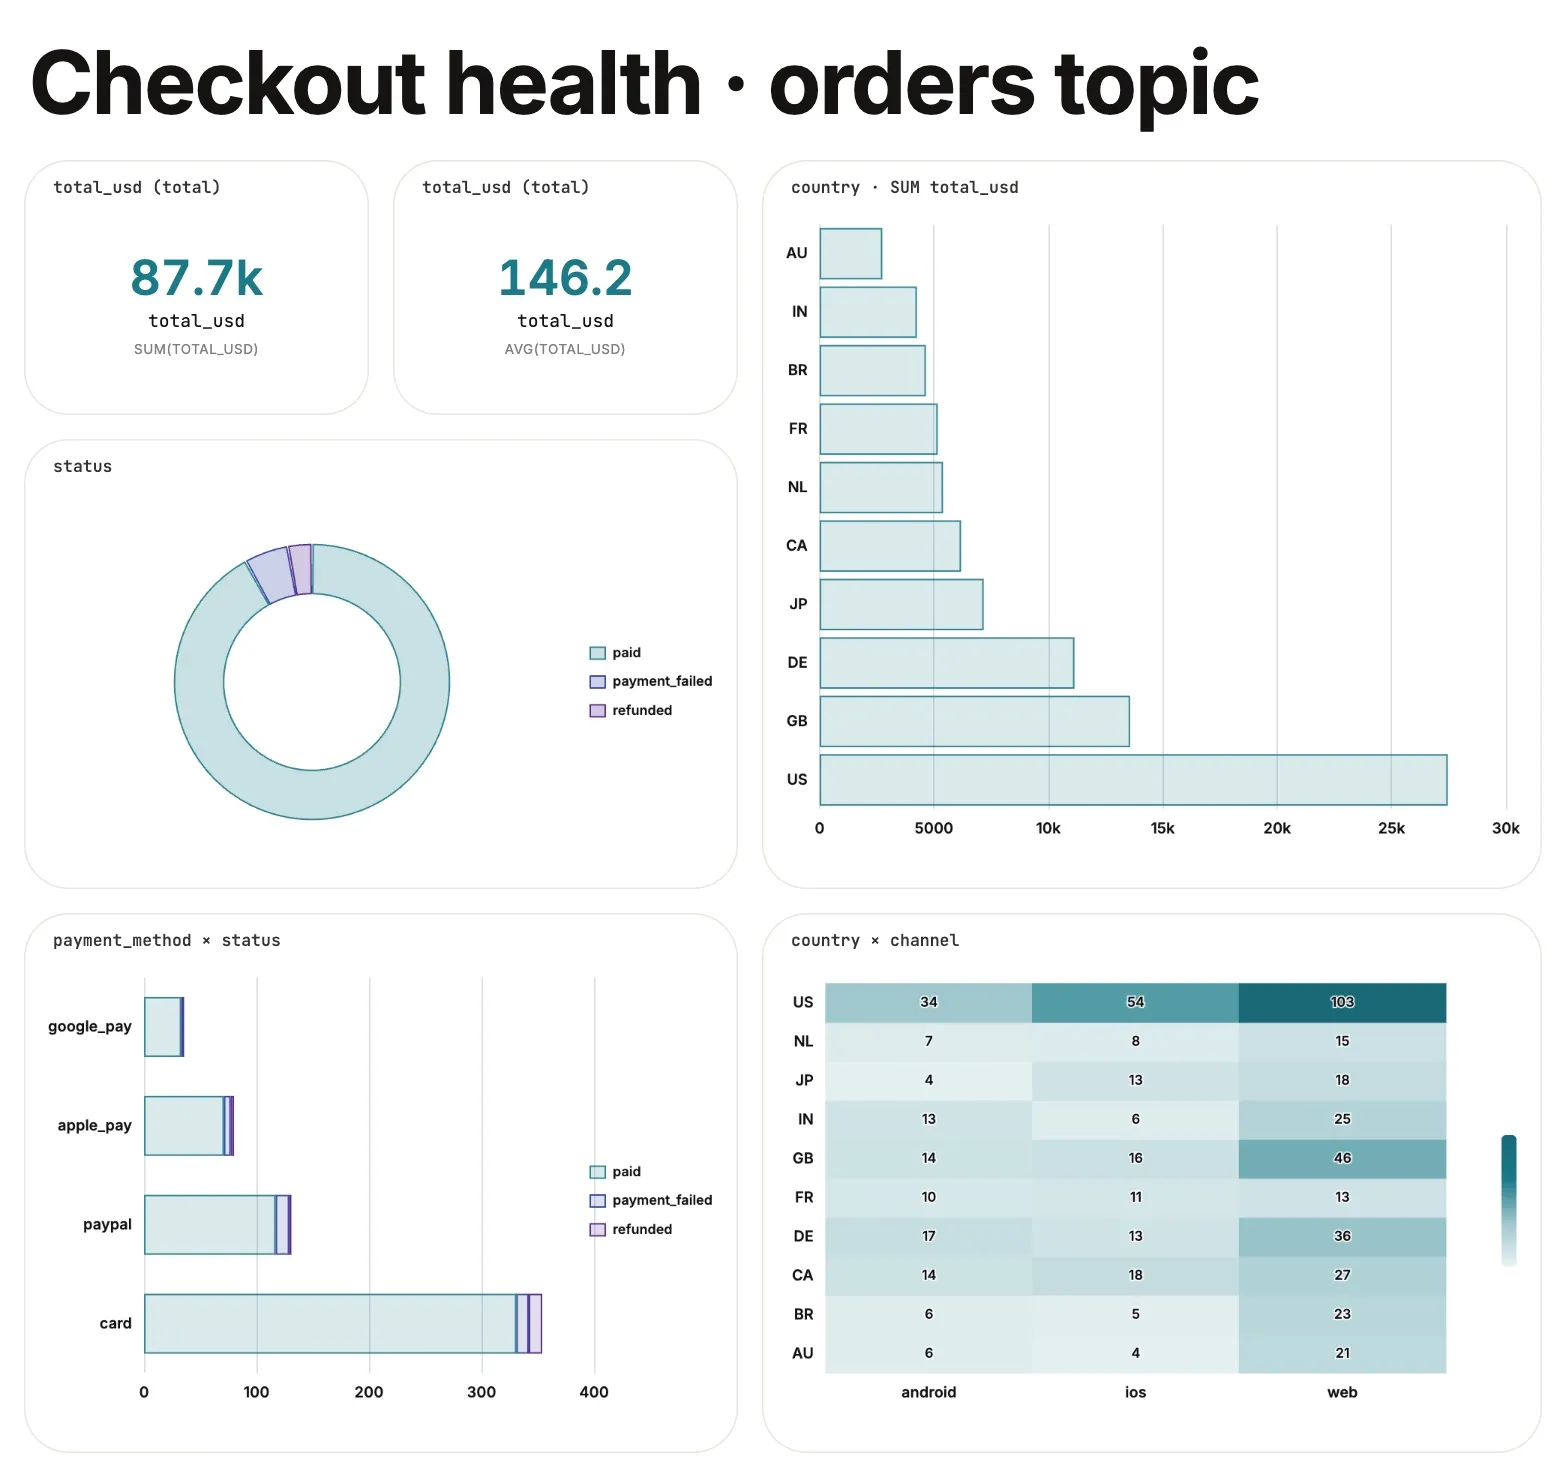
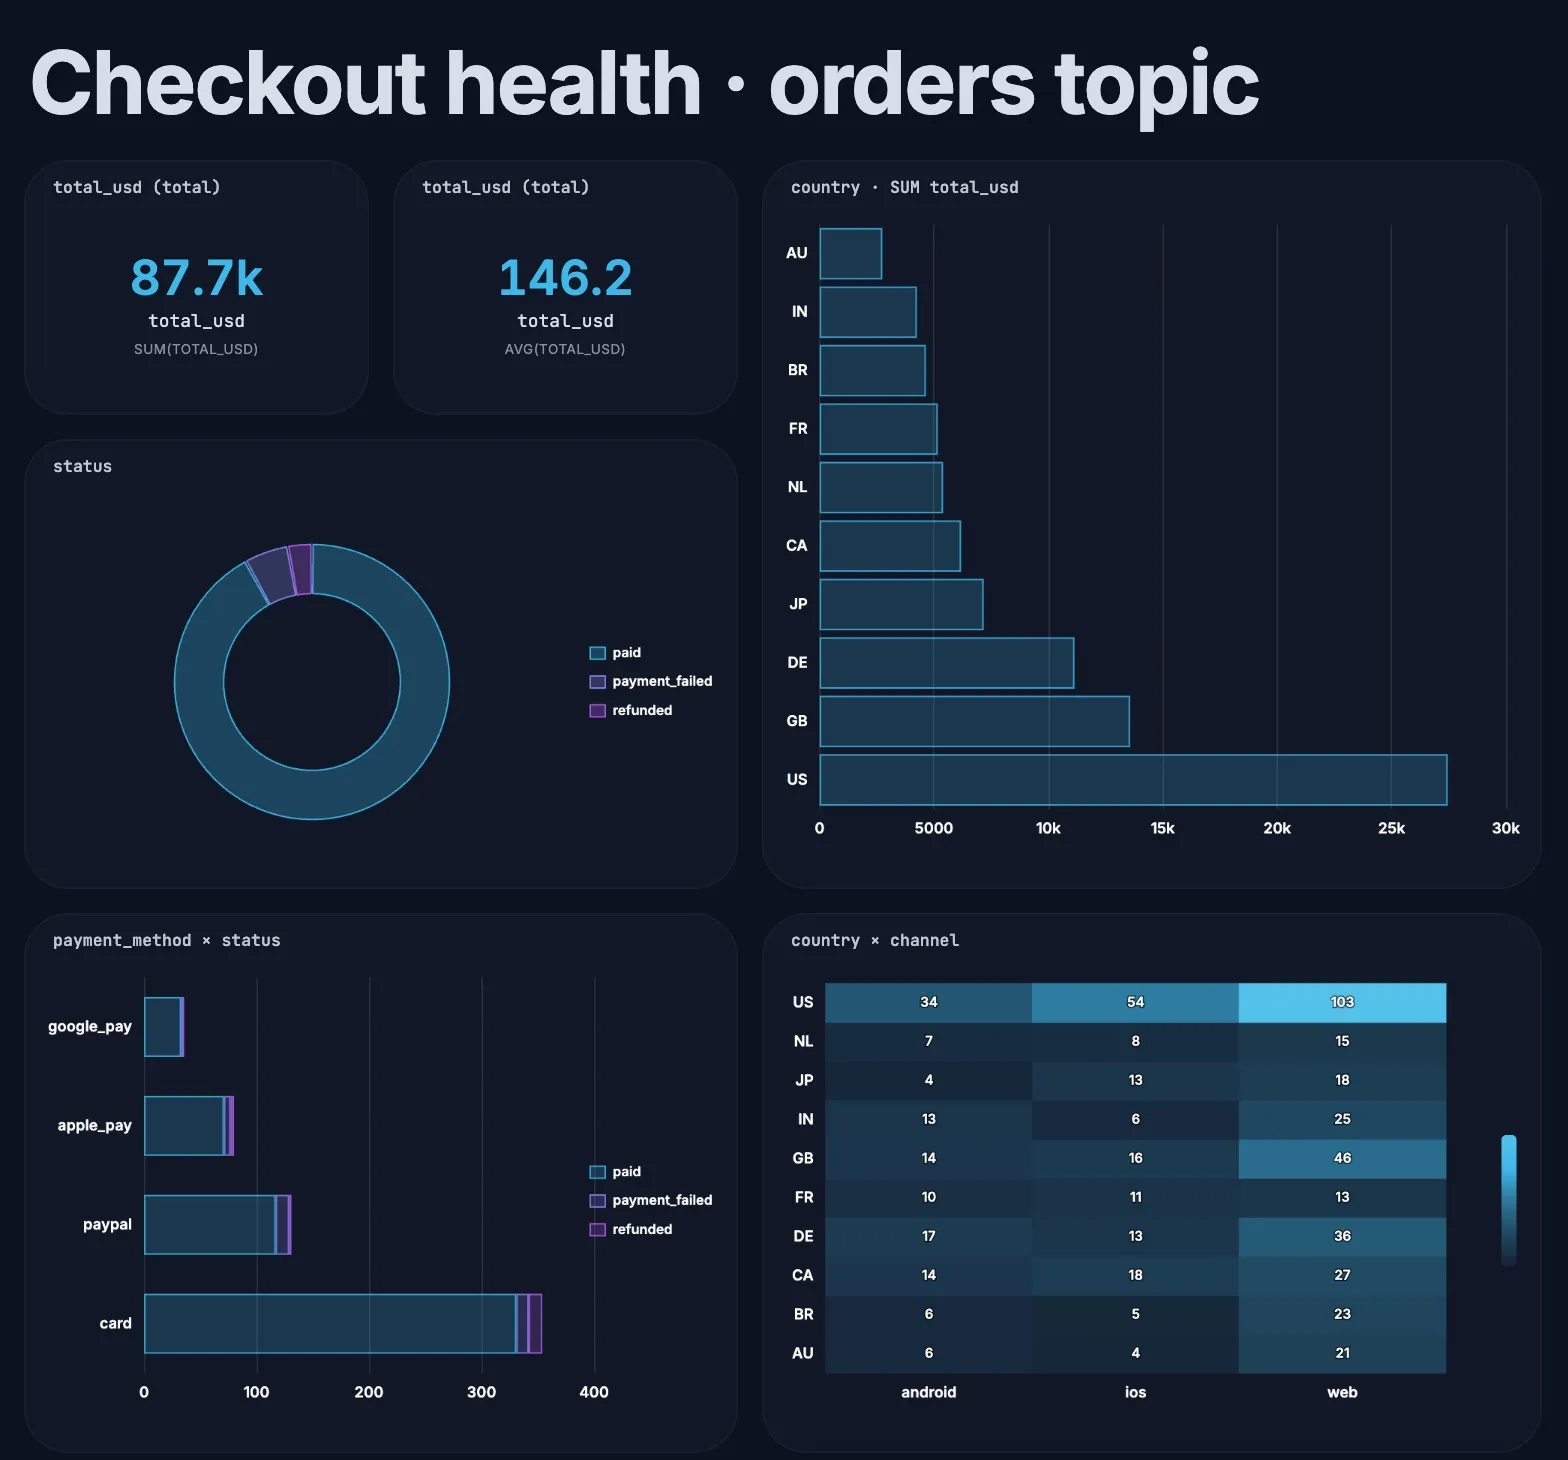
Chart types
Section titled “Chart types”| Chart | Best for |
|---|---|
| Auto | Let Explore choose from the field’s type and values |
| Bar, Horizontal bar | Comparing categories. Horizontal suits long labels |
| Line, Area | Change over time |
| Donut | Share of a whole, with a few categories |
| Histogram | The spread of a number, such as order values or latency |
| Stacked bar, Stacked horizontal | One field broken down by another |
| Heatmap | Two fields at once, such as country by channel |
| Parallel coordinates | Patterns across three or more fields |
| Table | Exact values |
| KPI | One number, such as total revenue |
Chart settings
Section titled “Chart settings”The ⋯ menu on each chart has the quick settings: Visualization, Max rows, Sort (by value or label, either way) and the Metric (COUNT, SUM, AVG, MIN or MAX). Time charts add the time bucket (auto, second, minute, hour or day), and histograms the number of bins.
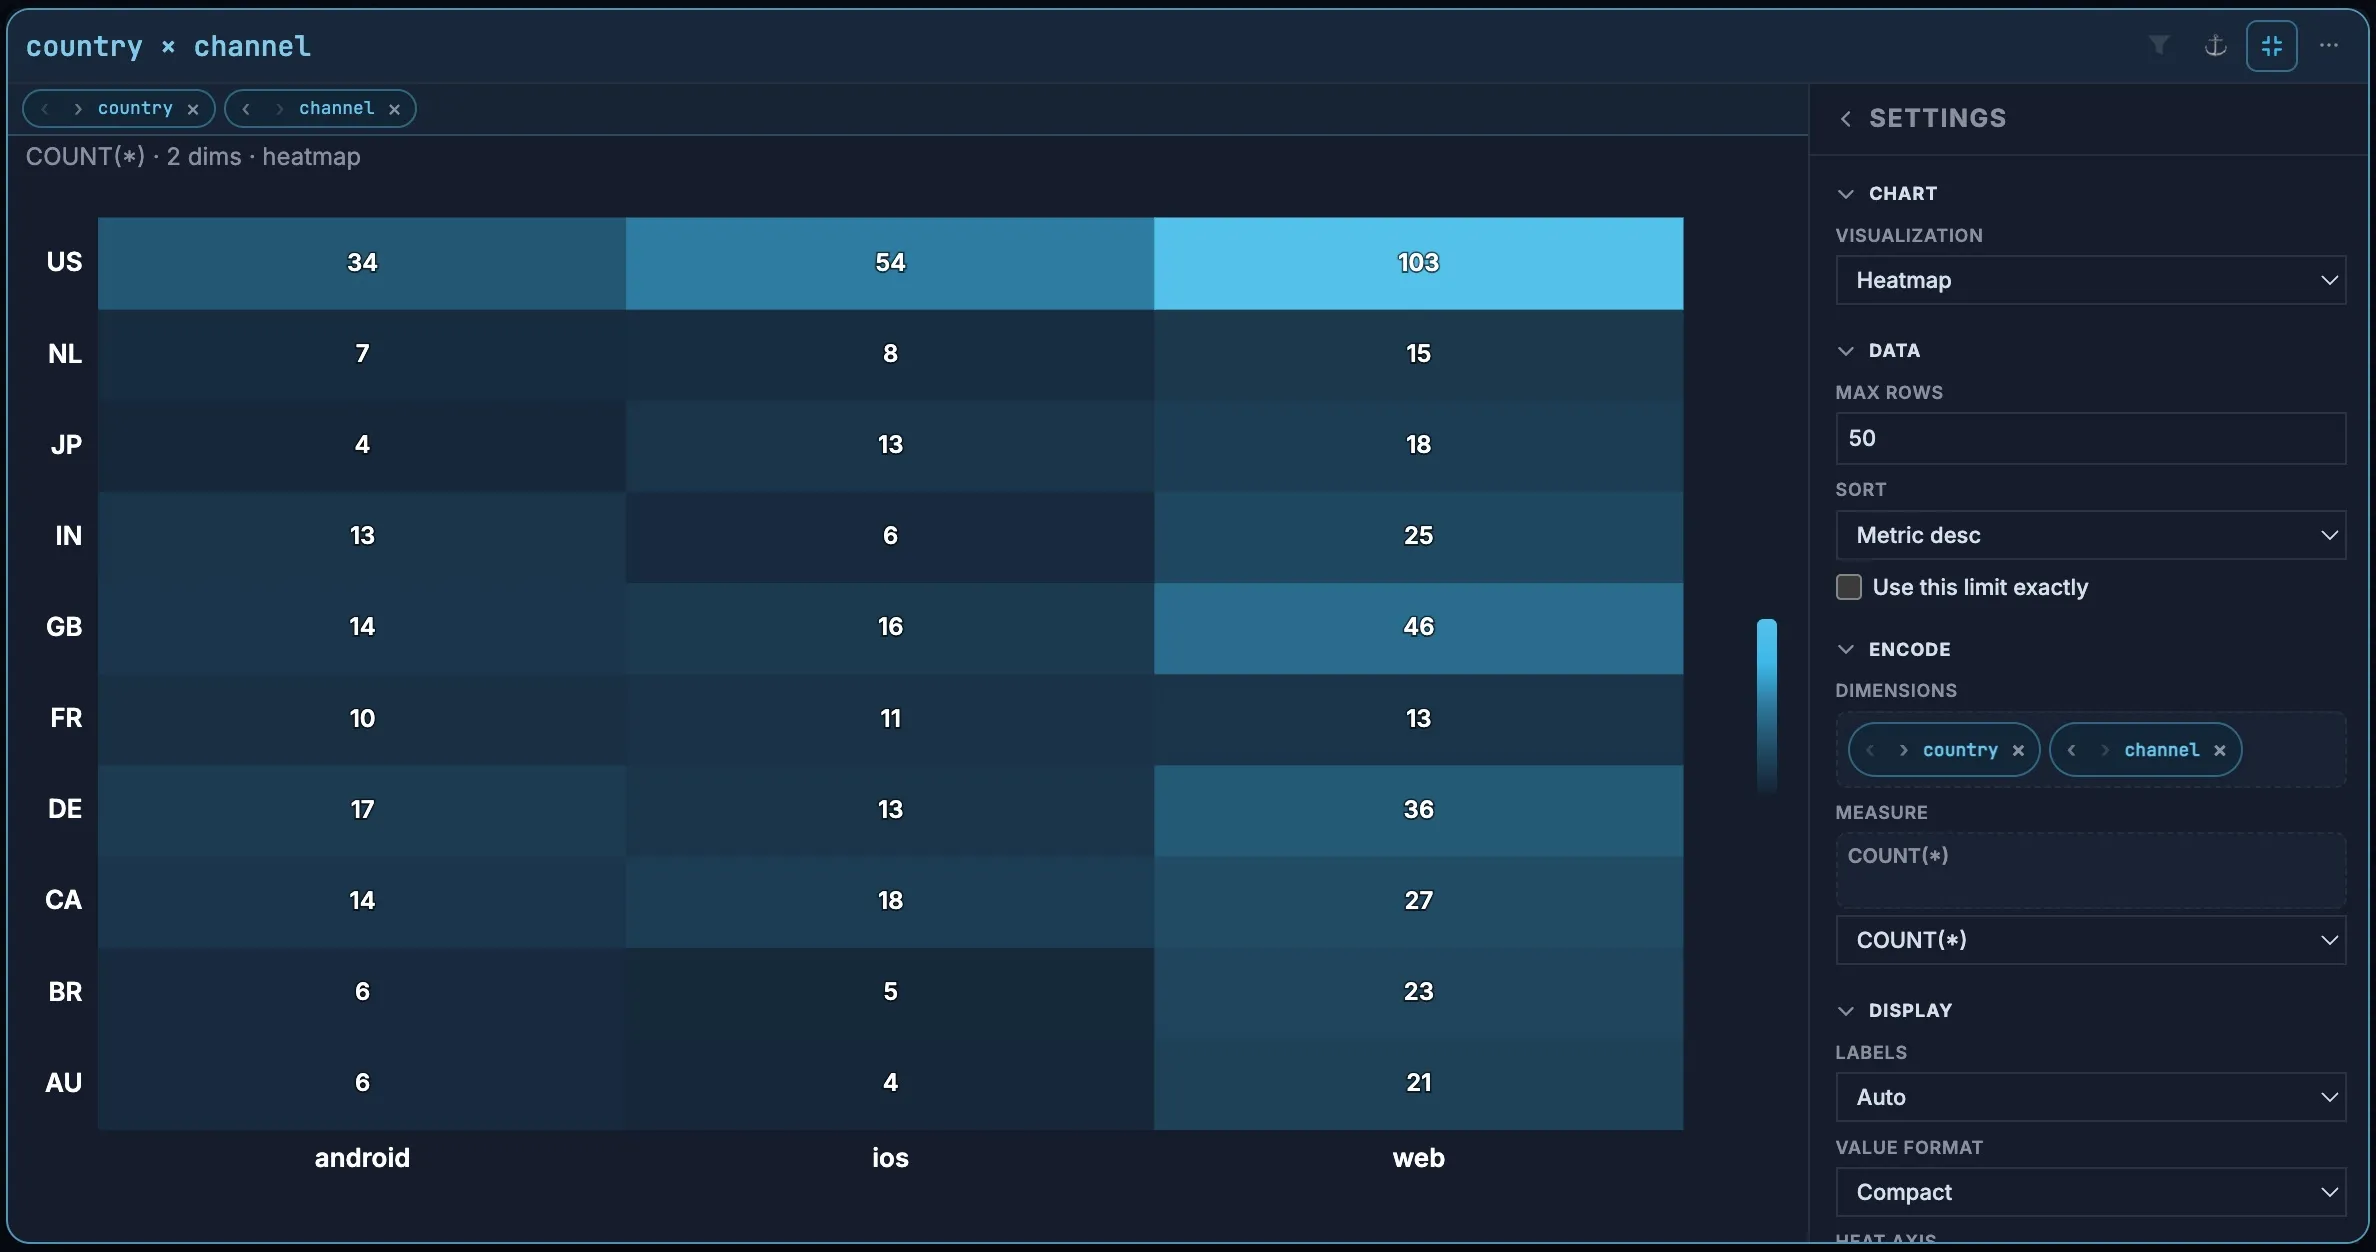
For everything else, maximize the chart with ⛶. The chart fills the canvas with a Settings pane beside it:
| Section | Settings |
|---|---|
| Chart | Visualization |
| Data | Max rows and sort order. Explore raises the row limit by itself for heatmaps, parallel coordinates and time charts; Use this limit exactly keeps it at your number |
| Encode | The dimensions and measure. Drag fields in from the palette, reorder or remove them |
| Display | Value labels (auto, on or off), number format (compact such as 87.7k, full, or grouped such as 87,700), and options for the chart type |
| Style | Series color and card background |
Filter by clicking
Section titled “Filter by clicking”Click any bar, slice or cell to filter by that value. A tag appears in the filter bar, and every chart on the canvas updates to show only matching messages. Click the same value again to remove it.
- Click several values to combine them.
- The funnel icon on a chart cycles that chart’s filter between on, partial and off, so you can compare with and without it.
- The funnel in the filter bar does the same for every filter at once.
- Clear all removes every filter.
This is the fastest way to answer “why”: click payment_failed, and the other charts show which payment method, country and channel the failures come from.
Profile every field with Catalog
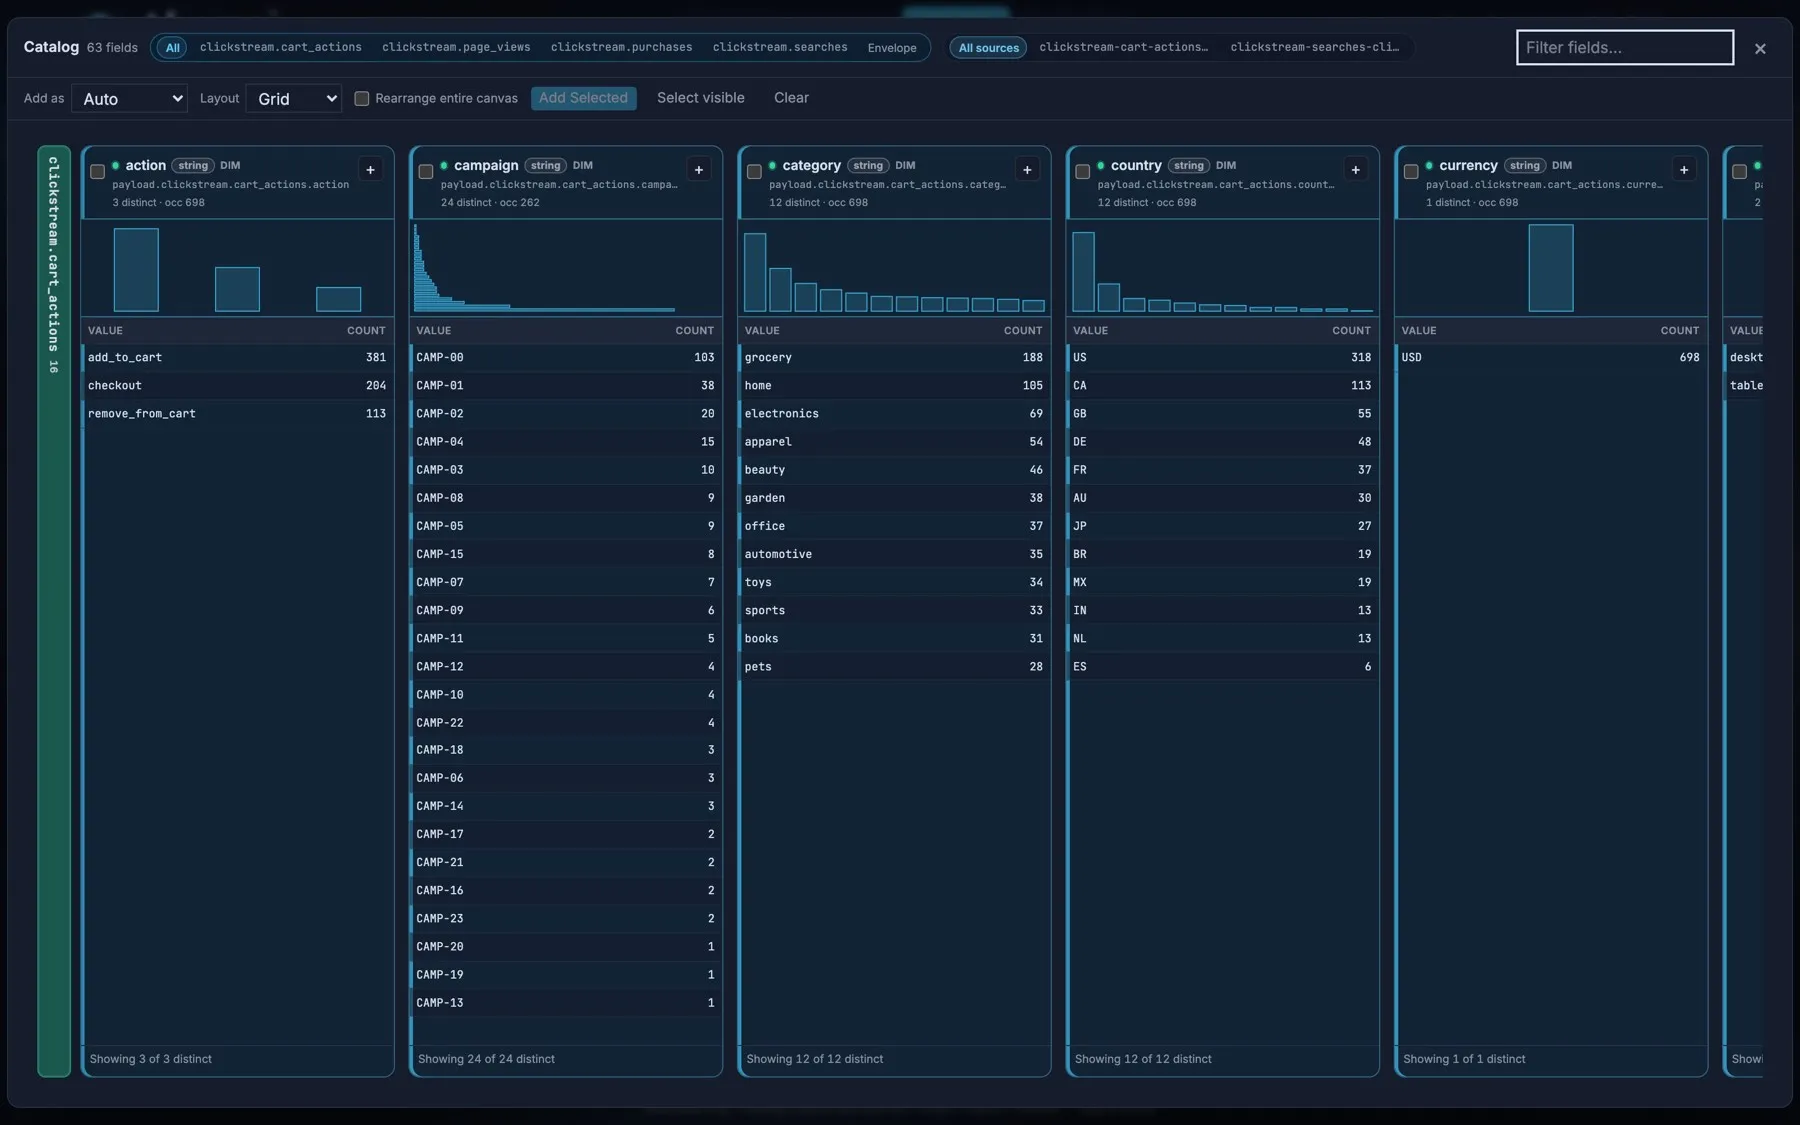
Section titled “Profile every field with Catalog”Catalog shows a profile of every field side by side: a small chart of its values and a table of its most common values and how often each appears. Use it to see what’s in the data before you build anything.
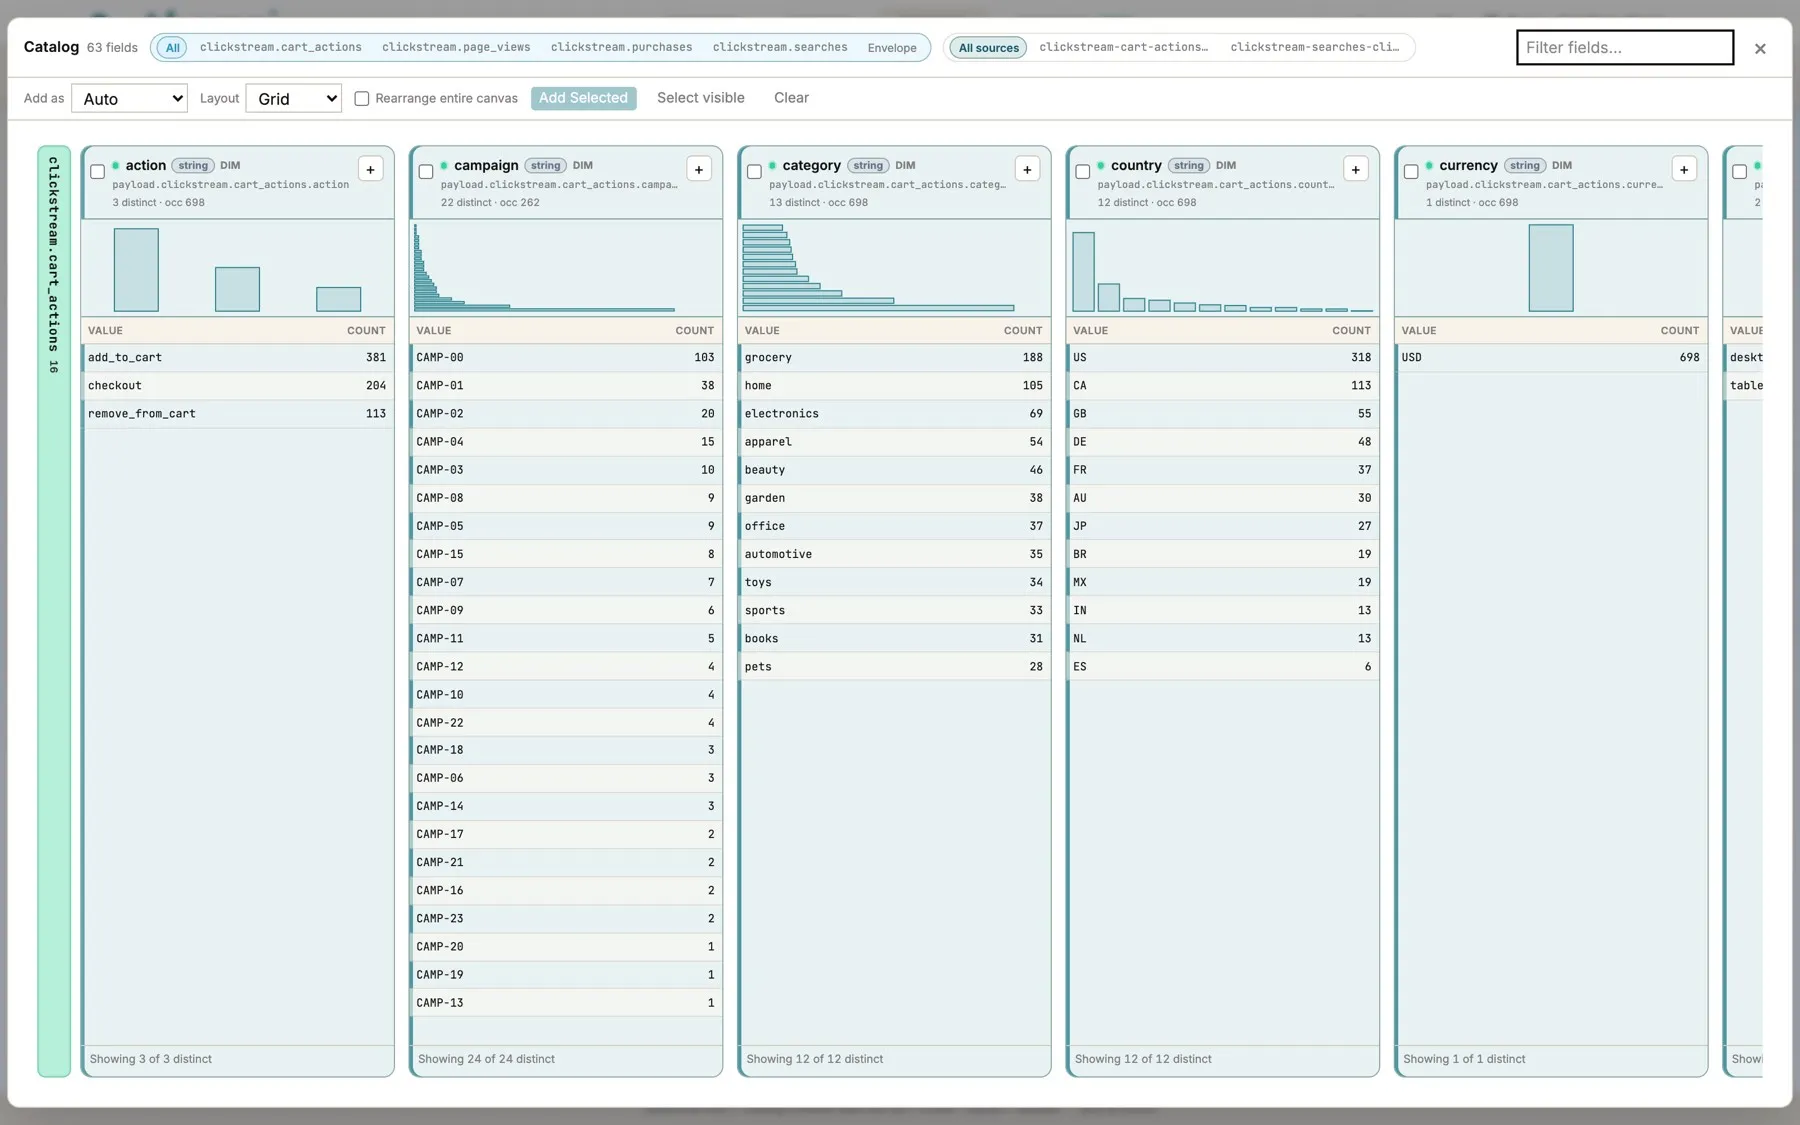
- Click a value to filter by it, as on the canvas.
- Filter the list by topic or source, or type to find a field.
- Check the fields you want, choose a chart type under Add as and an arrangement under Layout, then choose Add Selected to add them all to the canvas at once.
Lay out a dashboard
Section titled “Lay out a dashboard”The canvas is a board you can arrange freely.
- Text blocks add titles and notes. Choose headline, subtitle, body or caption, and resize the block to scale the text.
- Containers group charts into a grid. Each row can be split evenly (halves, thirds, quarters) or unevenly (wide left, wide middle, and so on). Select several charts and choose Group to put them in one.
- Auto-layout arranges everything as a grid, row, column, pack or circle.
- Use Pointer (V) to select and Pan (H) to move around. Zoom with the buttons or Ctrl/⌘ + scroll, Fit to see everything, and Focus to zoom to what’s selected. The Navigator in the corner shows where you are.
- Clear removes the charts but keeps your filters. Reset all clears charts, containers, filters and layout, but keeps the loaded data.
The layout is saved with the workspace, so it’s there the next time you open Explore. To share it, export the workspace’s settings from Settings → Portable client prefs.
Present
Section titled “Present”Present shows the canvas full screen as a clean, scrollable page: good for a meeting or a wall screen. The layout is locked so it can’t be moved by accident. Press Esc to exit.
| Control | What it does |
|---|---|
| Clean | Hides card headers and tools. Labels keeps chart titles |
| Glass | How solid the cards are over the background |
| Sizzle, Photo, Blur | An animated or still background in the display cover’s style, softened with Blur |
| Live | Keeps reloading while you present |
| Zoom, Pan | Scale the board, or move around it freely instead of scrolling |
| Anchors | Jump between the charts and text you marked with ⚓, in the order you choose |
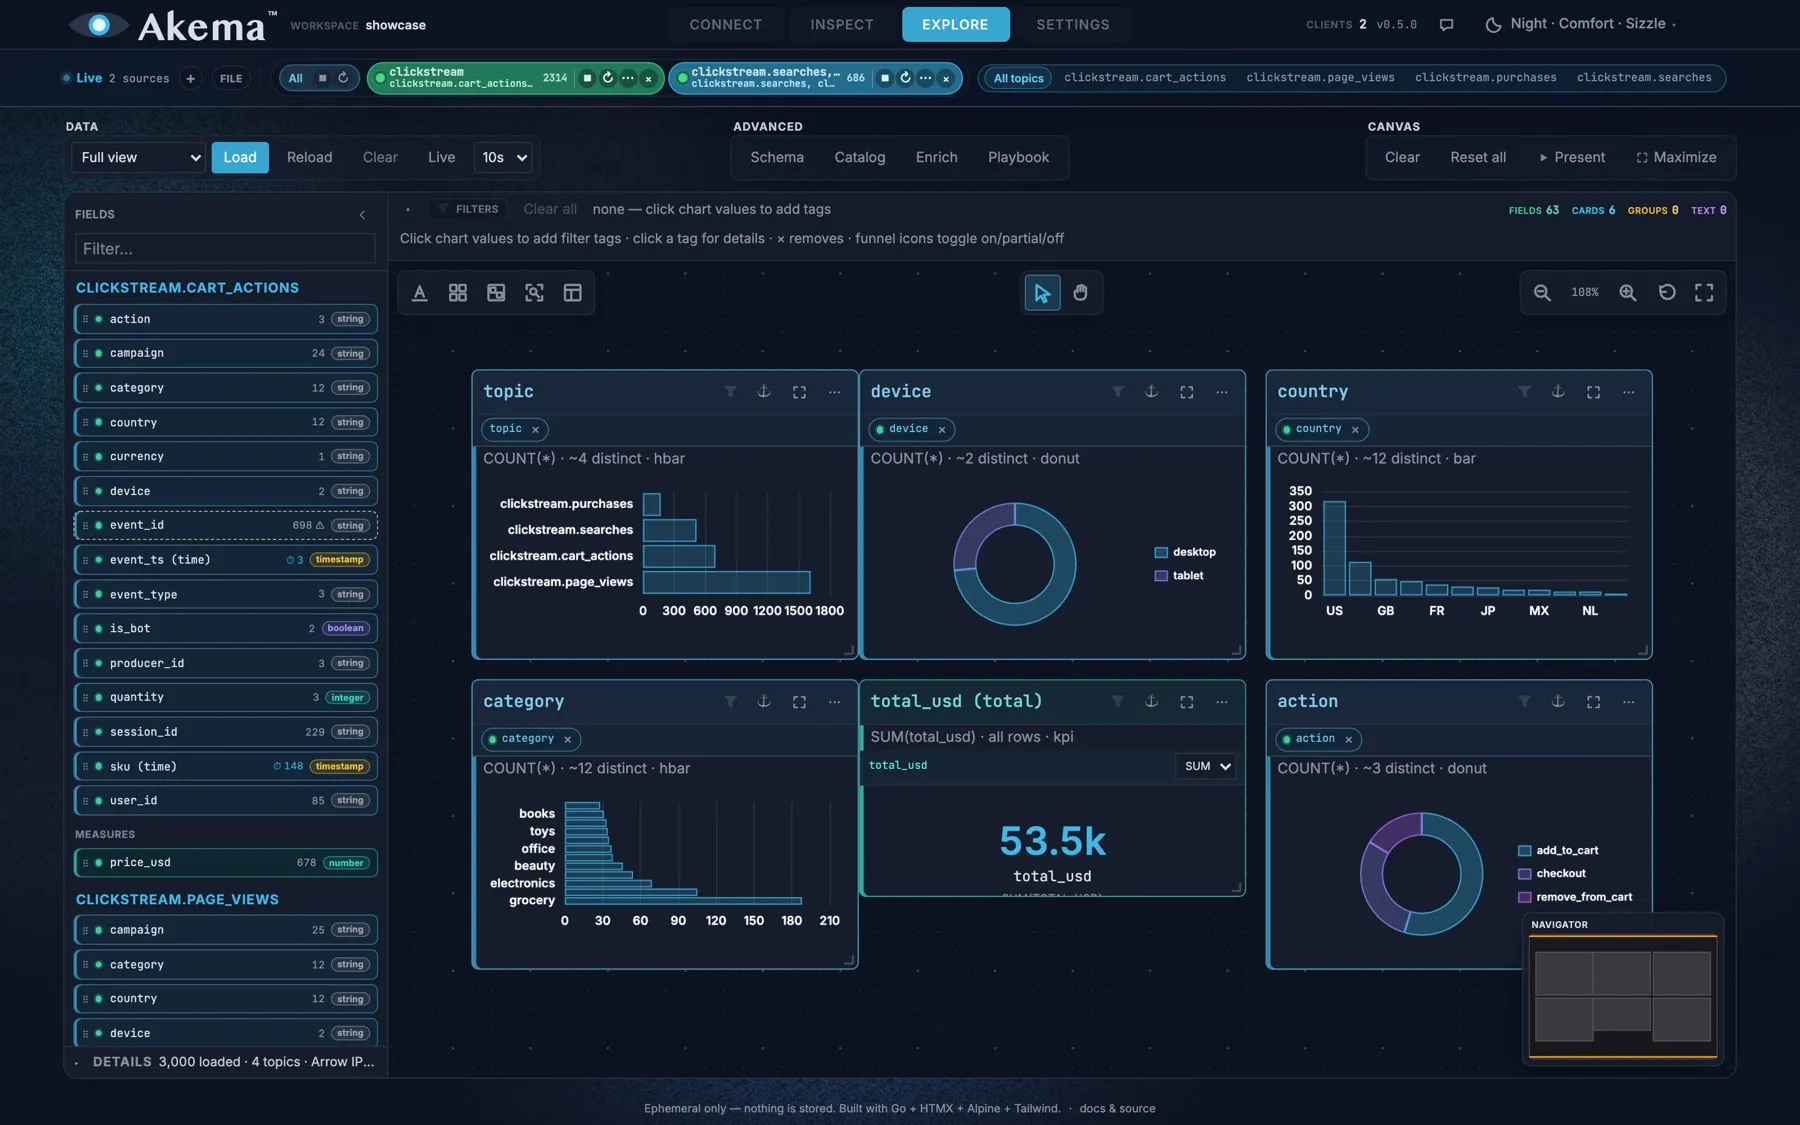
Present uses the colors of your display cover, such as Paper or Night, so charts match the rest of the screen.
Maximize is different: it gives the canvas the whole window while you keep editing, with the Fields palette still available.
SQL, playbooks and enrichment
Section titled “SQL, playbooks and enrichment”For questions charts don’t answer, query the loaded data with SQL.
Advanced SQL runs DuckDB SQL against the loaded data and can export the result as CSV. It includes example queries to start from. Open it from Playbook (choose a table in the diagram) or from Enrich. The tables are:
| Table | What it holds |
|---|---|
messages |
One row per loaded message: its envelope details and its JSON payload |
v_messages, v_<topic> |
Views with each payload field as its own column, so you can write status instead of json_extract_string(payload, '$.status') |
traps |
Each trap’s name, count and rate |
enrich_<name> |
CSV files you’ve attached |
Playbooks are saved checklists of queries and charts you run against each new window, such as “error rate by code” or “fields that went null”. Each cell is a read-only query or a chart; running a playbook never changes your canvas. A workspace can hold up to 8, and Akema includes samples to start from.
Enrich attaches a CSV file, such as a list of customers or product names, as an enrich_ table, so you can join it to messages in SQL. It survives Reload; Clear removes it.
Explore and PII redaction
Section titled “Explore and PII redaction”If a topic has a redaction profile, Explore only ever receives the substitutes, and redacted fields carry a redacted chip in the palette. Tokens are consistent, so counts, group-by and distinct counts still work. Files loaded as fixtures aren’t redacted.
- Charts look empty after a change elsewhere? Explore shows a snapshot. Choose Reload, or turn on Live.
- Too many bars to read? Lower Max rows, or filter first.
- A number is grouped like a category? Change its role to Measure in Schema.
- A time isn’t treated as a time? Change its type to timestamp in Schema.
- Explore is slow or the tab runs out of memory? Load with Sample every N, or see Settings for Explore engine RAM.