

Clickstream
Tracking what users do on a website was the job Kafka was first built for: every page view, search and cart change becomes an event, and analytics, recommendations and fraud checks each read the stream on their own. Clickstream topics are busy and mostly routine, so the events that matter, such as a bot buying something, are easy to miss.
Akema lets you watch the activity topics as they fill, pick out the events worth a second look, and check the traffic with SQL, before it lands in a warehouse.
The example
Section titled “The example”An online store has three web frontends and a mobile app, all writing JSON events to one topic per activity:
| Topic | Key | Events |
|---|---|---|
clickstream.page_views |
session_id |
A page visited, with the referring page |
clickstream.searches |
session_id |
A search, with the query and how many results it found |
clickstream.cart_actions |
session_id |
add_to_cart, remove_from_cart or checkout |
clickstream.purchases |
user_id, or session_id for guests |
An order, with its items and total_usd |
Keying by session keeps a session’s events in order on one partition. Every event also carries the device, country, marketing campaign (often empty) and an is_bot flag from the bot detector. About 2% of traffic is bots, and some users aren’t signed in, so their user_id is empty.
A search event looks like this:
{ "event_type": "search", "session_id": "S00000485", "user_id": "U000381", "device": "ios", "country": "US", "campaign": null, "is_bot": false, "search_query": "wifi router pro", "result_count": 1}1. Connect
Section titled “1. Connect”On Connect, add a source for your cluster with all four topics. Clickstream topics are busy and keep a long history, so set Start mode to Latest (tail) to watch new activity, or Timestamp to look at a particular hour. See Connect to Kafka.
2. Trap what’s worth a look
Section titled “2. Trap what’s worth a look”Add these traps:
| Trap | Expression | Catches |
|---|---|---|
bot_traffic |
value_json.is_bot == true |
Every event the bot detector flagged |
bot_purchase |
topic == "clickstream.purchases" && value_json.is_bot == true |
Bots that got all the way to buying, a sign of card testing or scalping |
large_purchase |
topic == "clickstream.purchases" && value_json.total_usd > 750 |
Orders over $750 |
poor_search |
topic == "clickstream.searches" && value_json.result_count < 3 |
Searches that found almost nothing: missing products or a broken search index |
In a minute of traffic, about 6,000 events, Akema caught 134 bot events, 7 bot purchases, 11 large purchases and 10 poor searches.
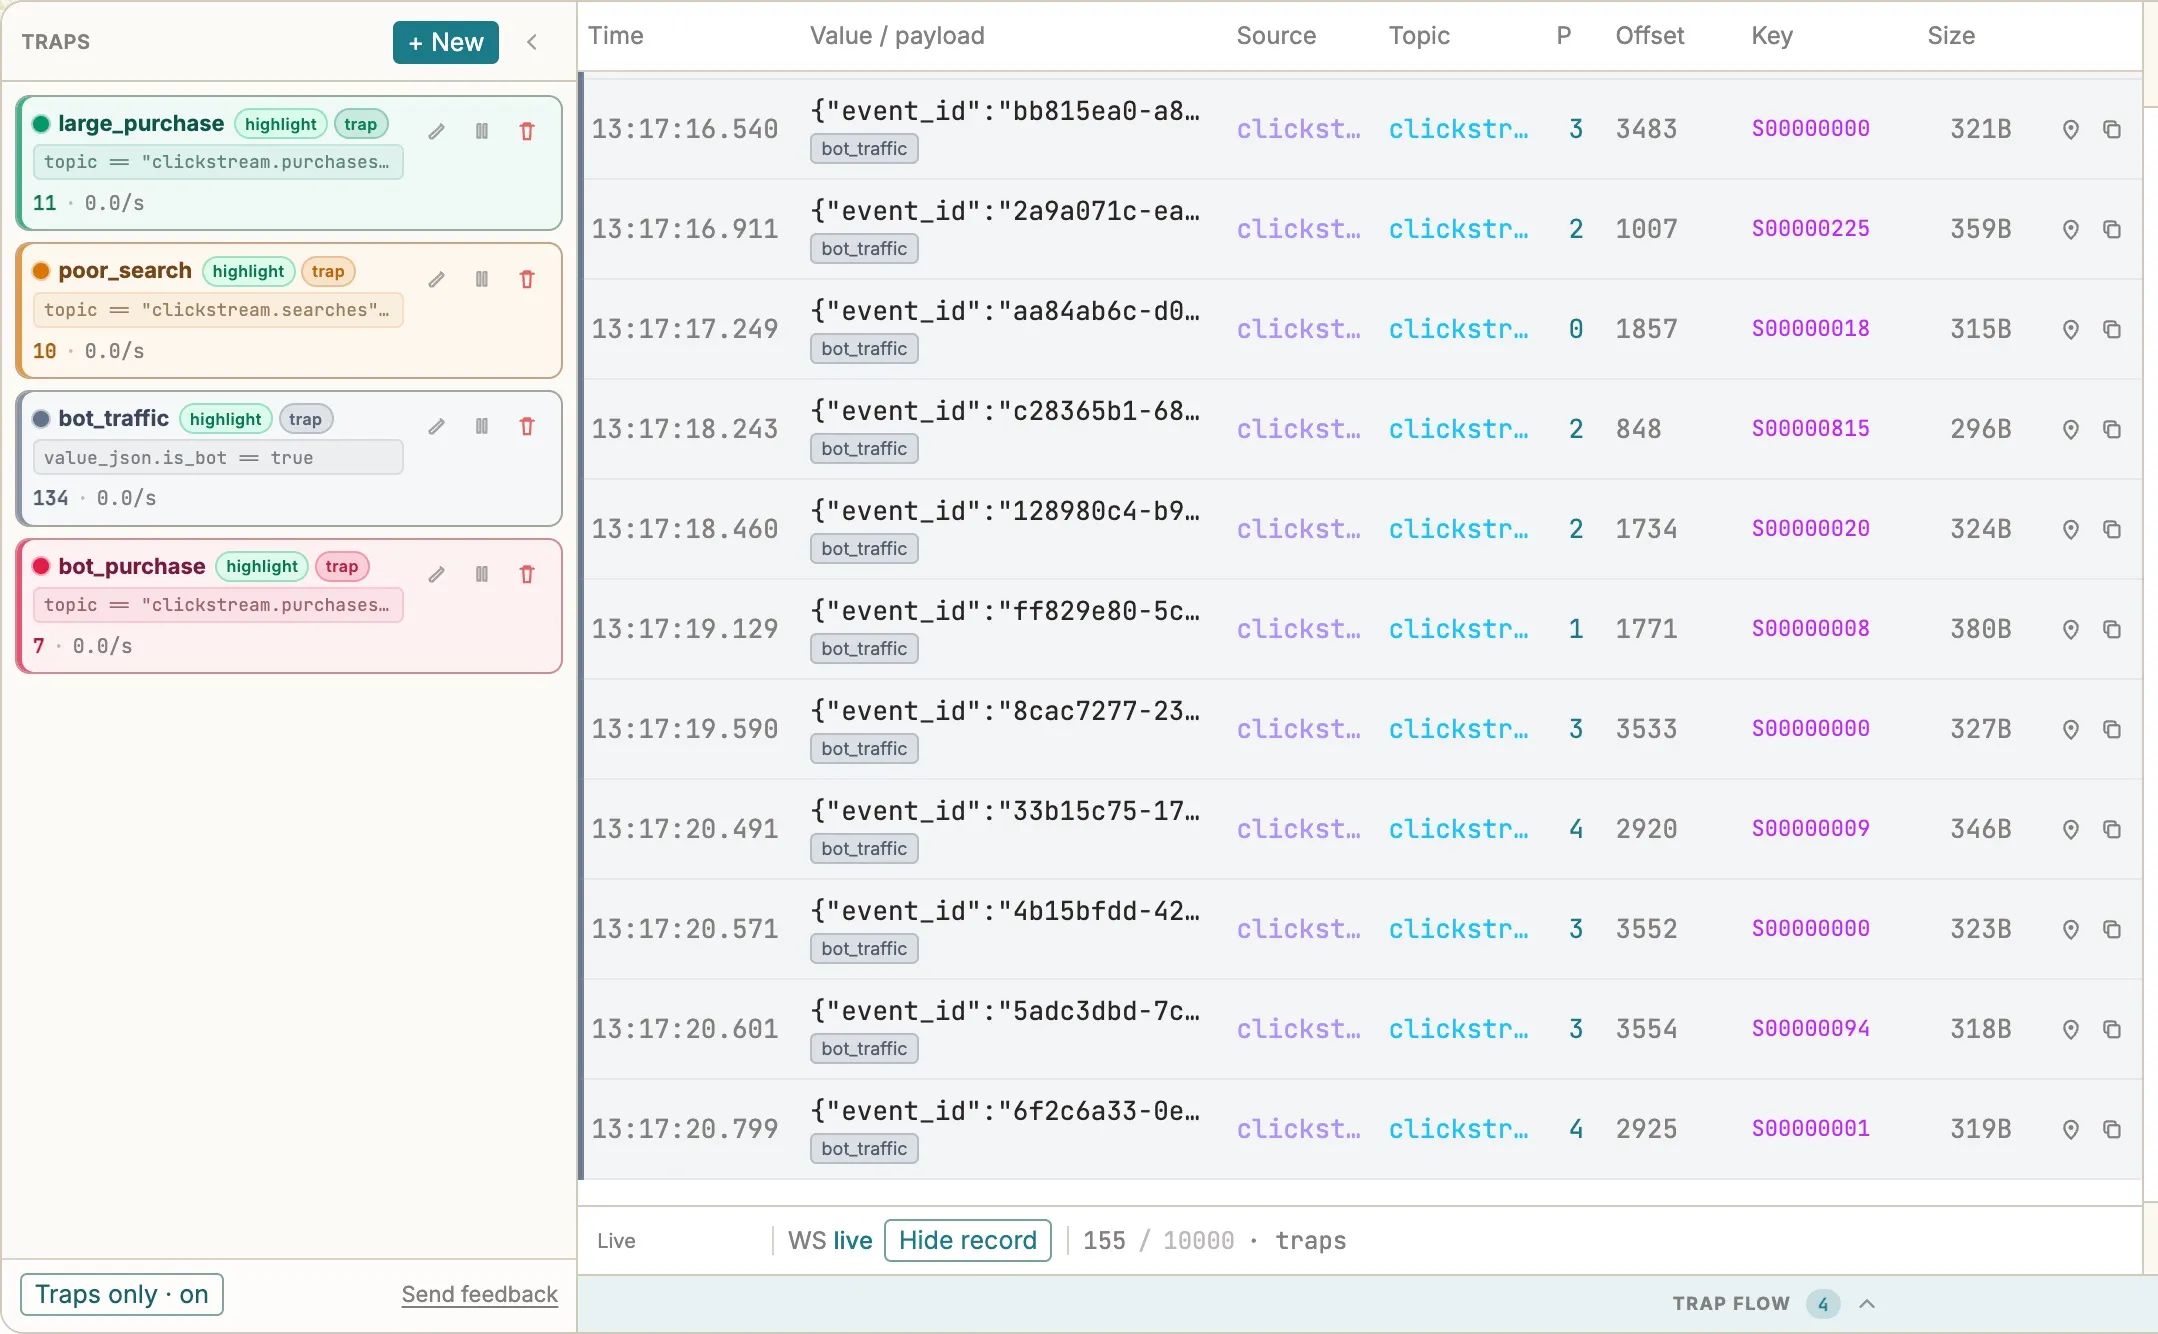
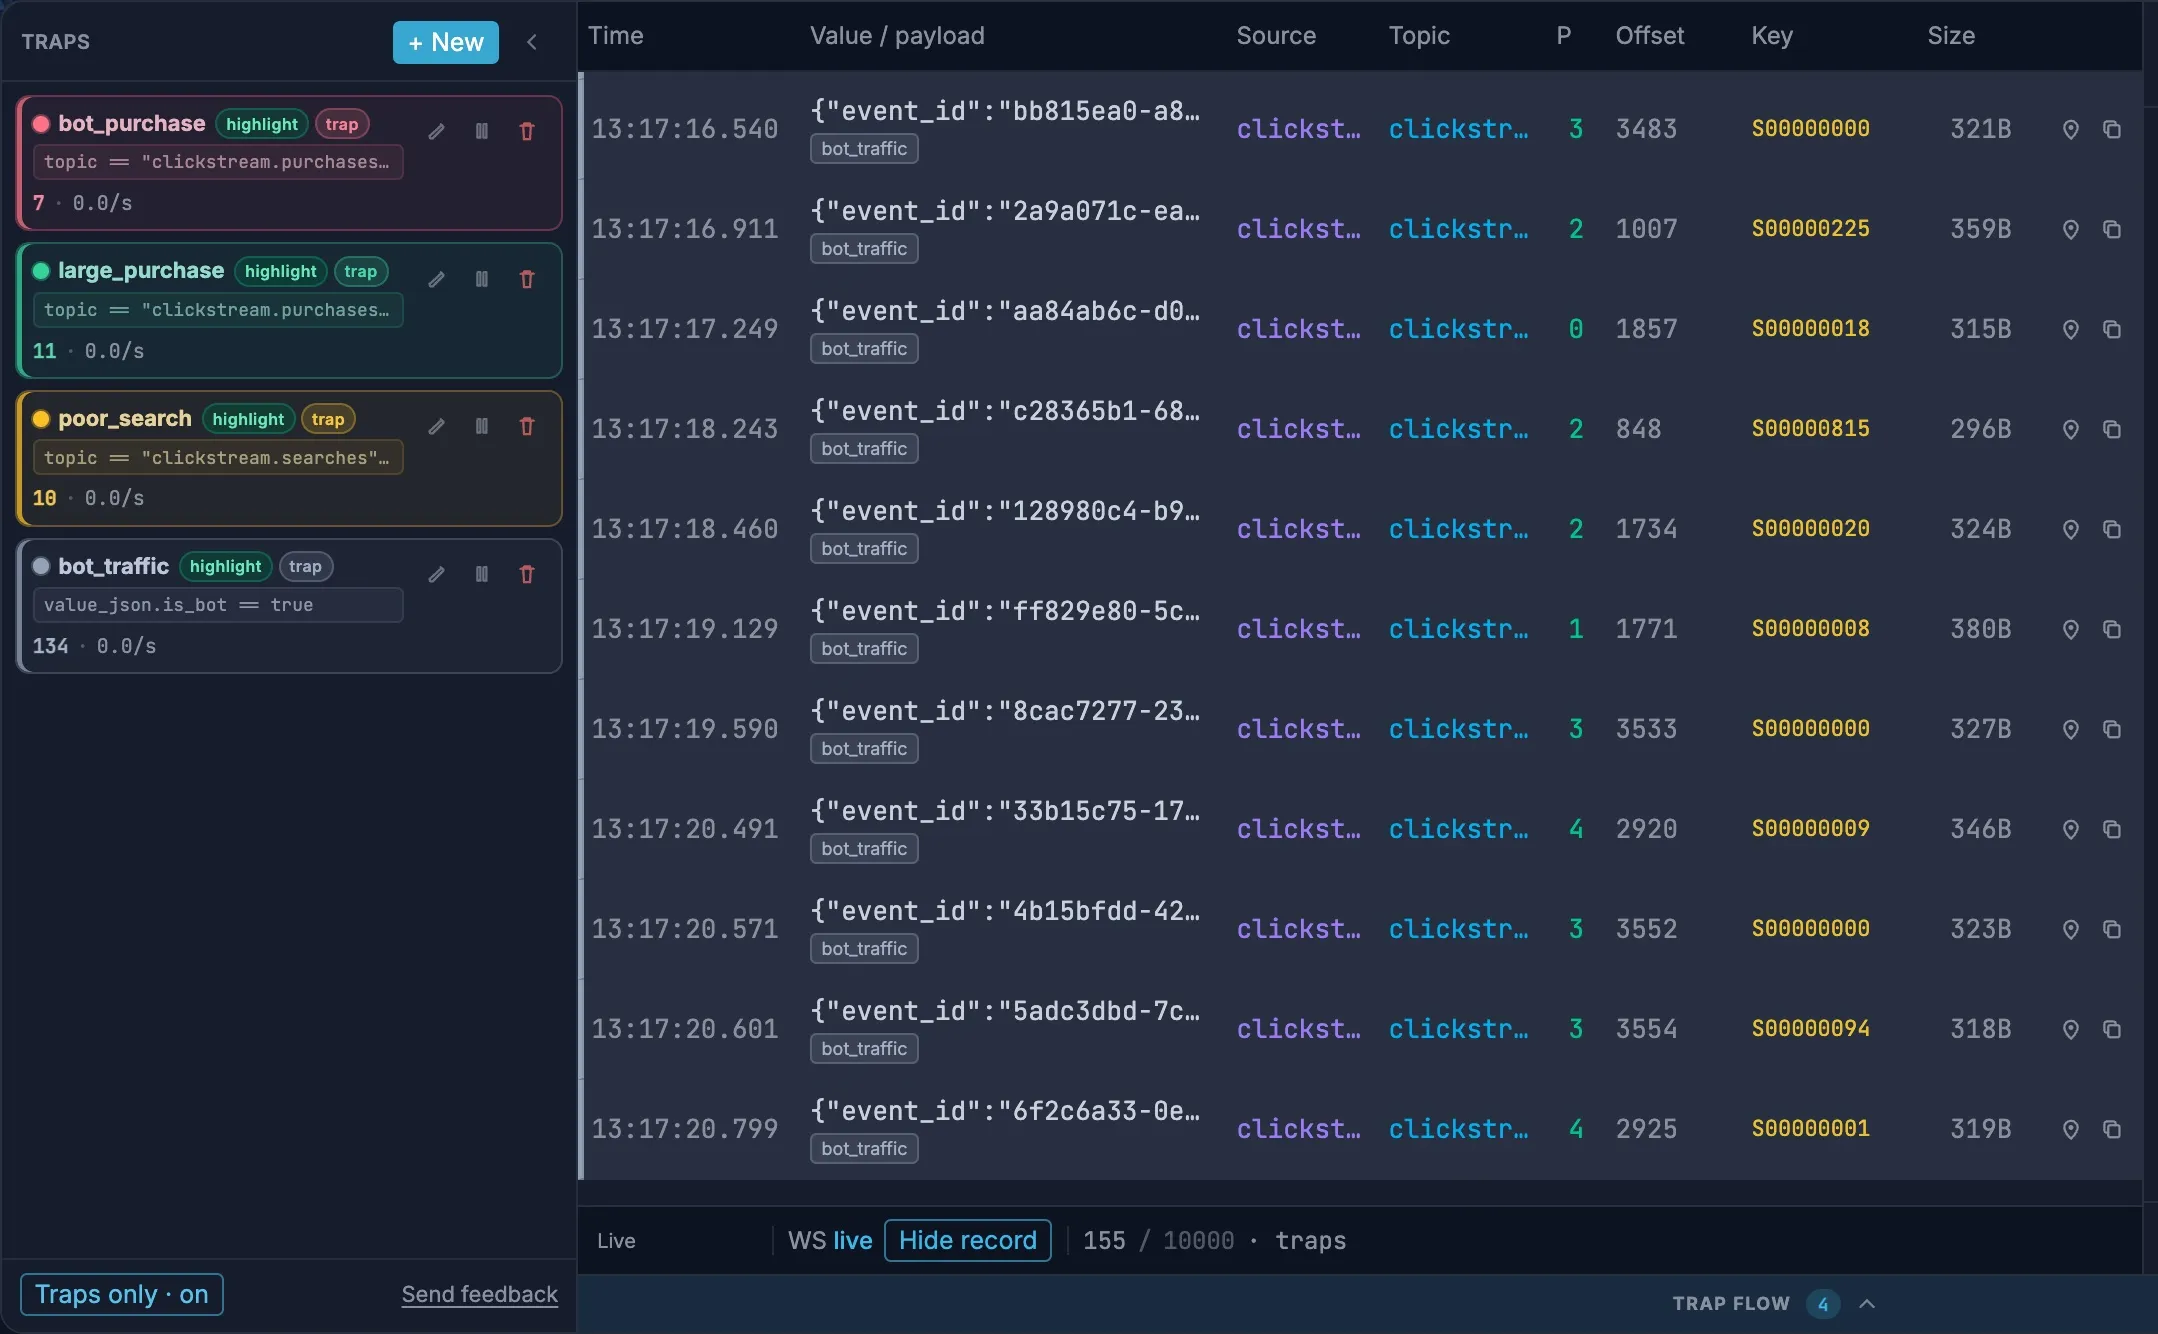
bot_traffic is the noisy one. Click bot_purchase instead to see only bots that bought something, or turn on Traps only to hide the routine traffic.
3. See where the revenue comes from
Section titled “3. See where the revenue comes from”Clickstream is the classic dashboard workload: traffic, funnels and revenue by campaign. Explore builds those from the live topics in a few drags, before the events reach a warehouse. Choose Load to start.
Click through to the revenue
Section titled “Click through to the revenue”- Drag
is_botfromclickstream.purchasesonto the canvas and clickfalse, so the purchase charts leave out bots. - Drag
campaignfromclickstream.purchasesonto the canvas, droptotal_usdonto that chart, and choose SUM. You get revenue per campaign. - Drag
deviceandcountryfromclickstream.purchasesnext to it. Click a campaign to see which devices and countries it brought in.
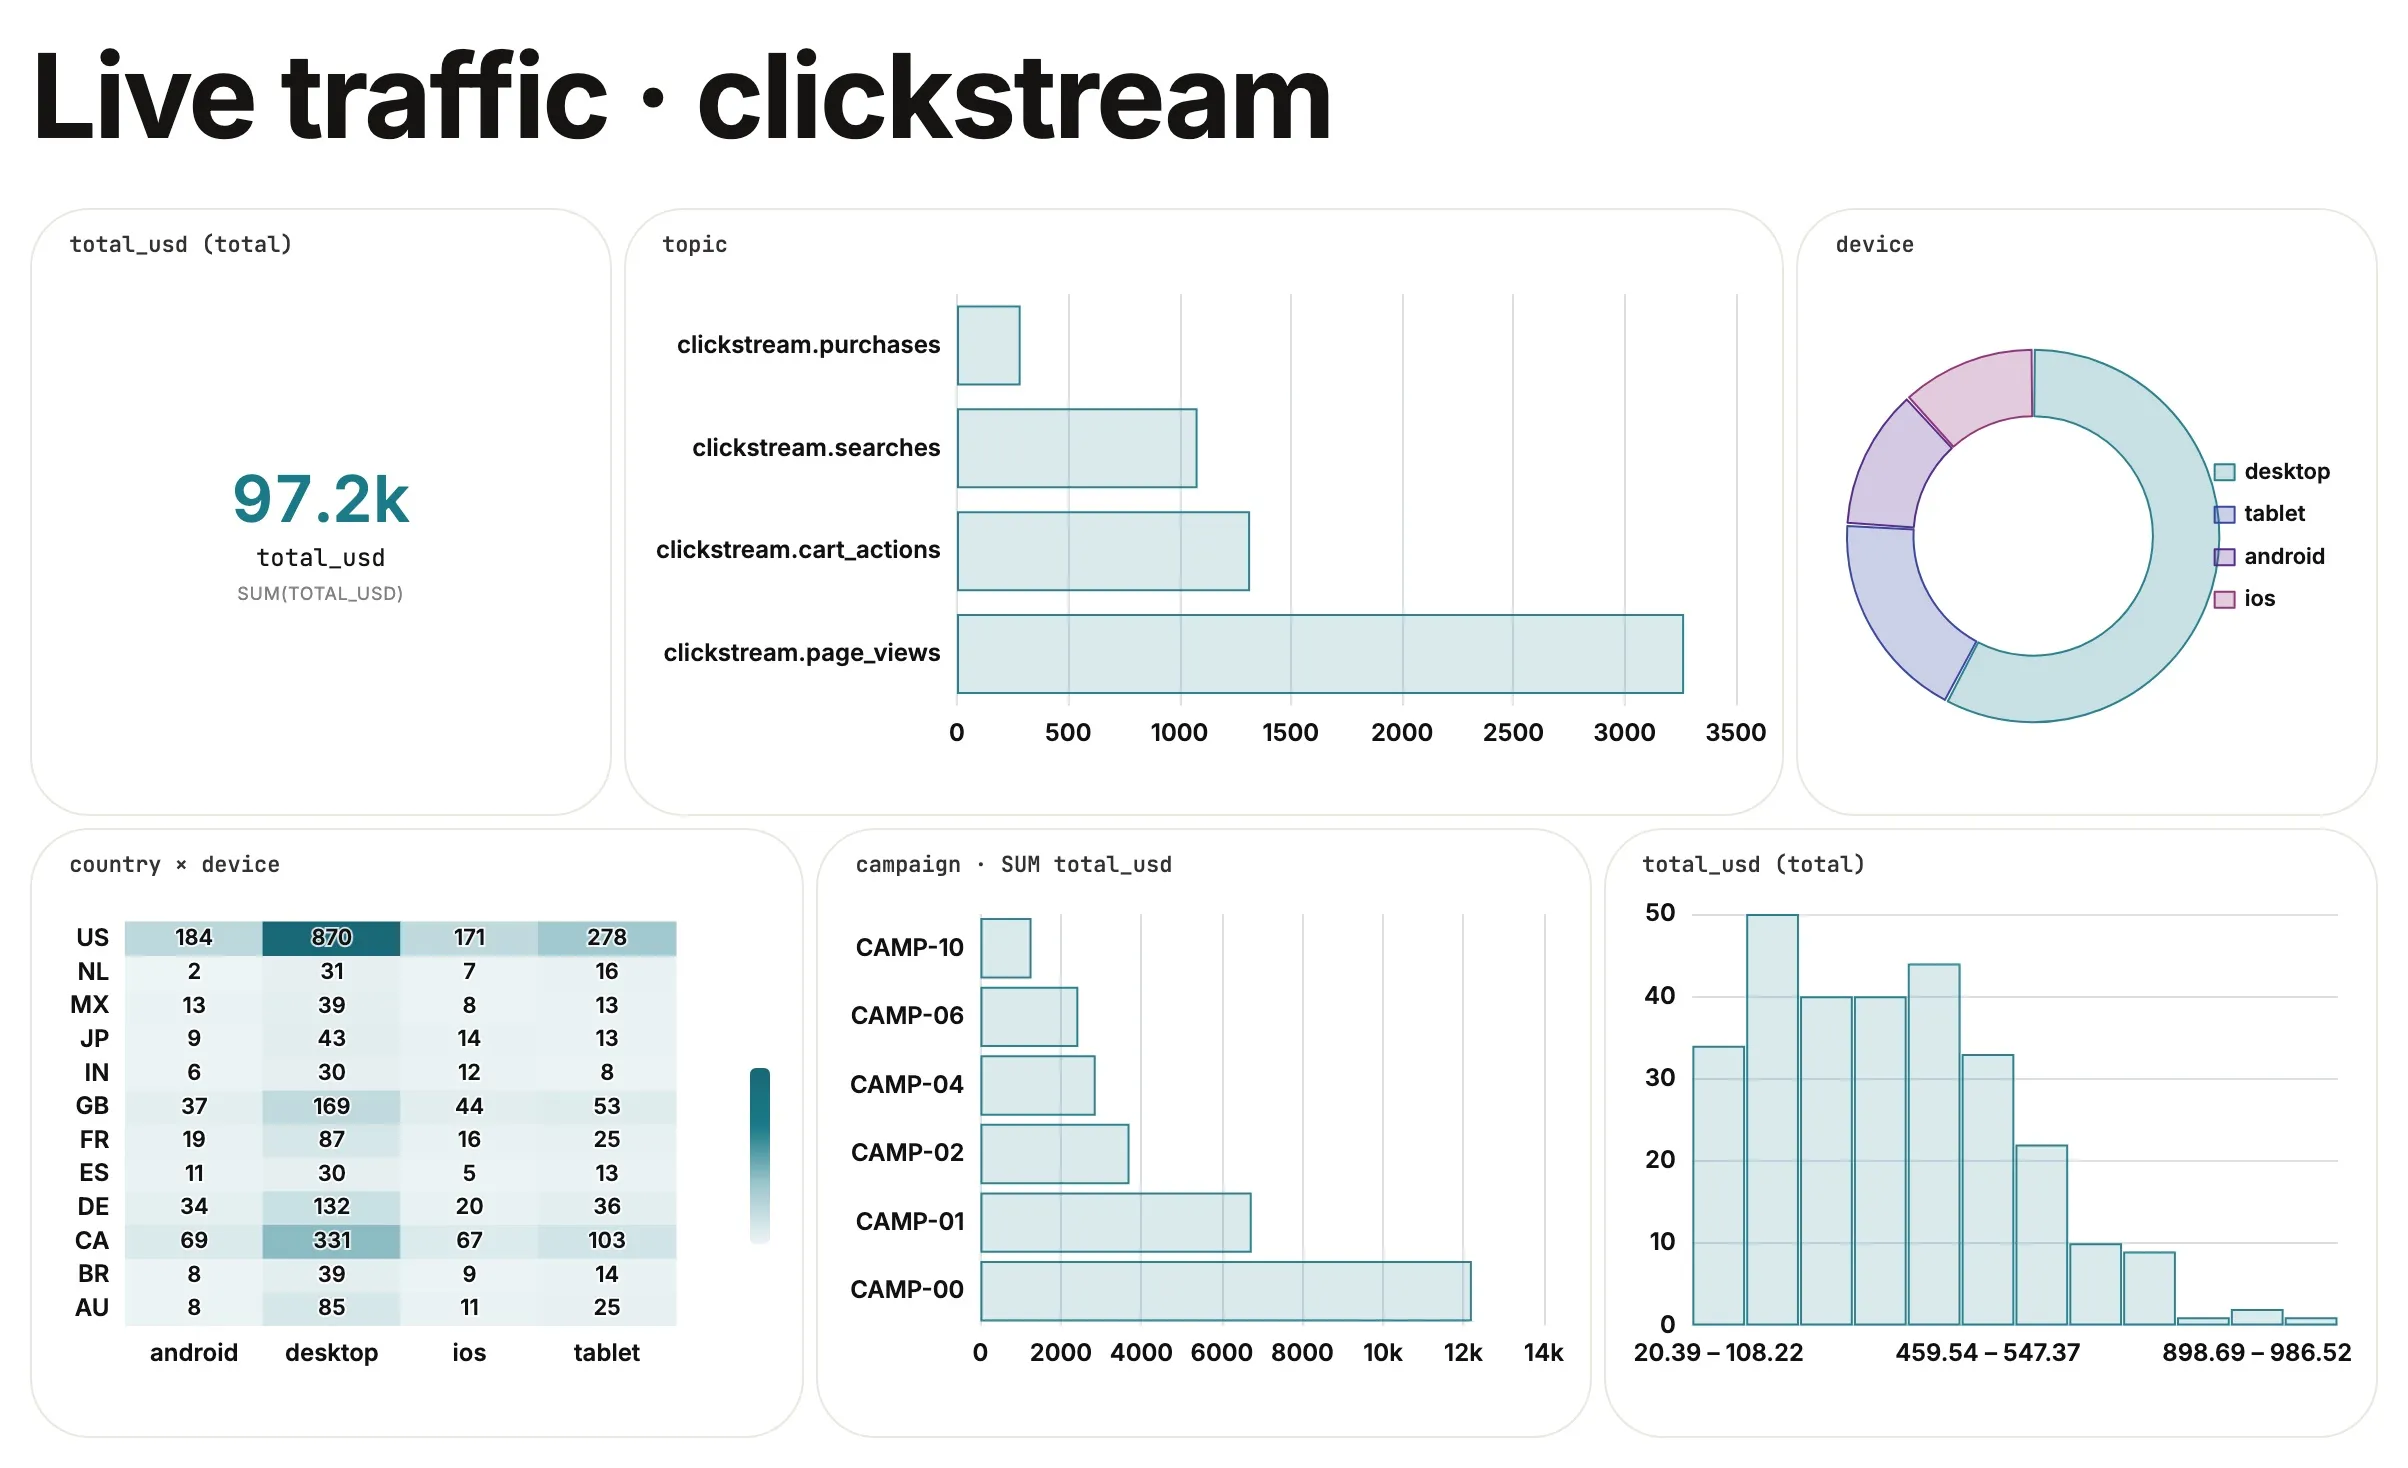
In the example, most orders came without a campaign, and of the campaigns, CAMP-00 brought in the most revenue, more than the next two together. Mobile apps brought in about a quarter of the revenue, iOS and Android about equally.
To check search quality, drag search_query onto the canvas and click the poor_search trap first: the chart shows which searches keep finding nothing.
A filter applies to the charts from the topic it came from. Clicking false on the purchases’ is_bot leaves the page view and search charts as they are; to leave bots out of those too, add is_bot from their topic and click false there.
See the funnel at a glance
Section titled “See the funnel at a glance”Click false on is_bot again to clear it first: charts of Envelope fields such as topic and time follow every filter, so with it on they’d count purchases only. Then drag topic from Envelope onto the canvas and choose Horizontal bar, sorted by value. It’s the shape of the store’s traffic: in the example, about 3,300 page views in the minute, 1,300 cart actions, 1,100 searches and 290 purchases. Cart actions outnumber searches because they count every add, remove and checkout.
The proportions matter more than the numbers. If the purchases bar shrinks while page views hold steady, something between browsing and buying broke, such as checkout or payments. The funnel query in the playbook below counts sessions at each step for an exact version.
See the spread of order values
Section titled “See the spread of order values”Drag total_usd from clickstream.purchases onto empty canvas, then choose Histogram in its ⋯ menu. Most orders were under $400, with a thin tail past $700; the orders over $750 that the large_purchase trap catches are the far end of it. Click true on is_bot to compare what bots bought.
Build a live traffic board
Section titled “Build a live traffic board”| Card | How to make it |
|---|---|
| Traffic by topic | topic from Envelope, as a Horizontal bar |
| Revenue | total_usd from clickstream.purchases dropped on empty canvas for a KPI, with SUM |
| Revenue by campaign | campaign with SUM of total_usd |
| Devices | device from clickstream.page_views, as a Donut |
| Device by country | country from clickstream.page_views, with device dropped on it, as a Heatmap |
| Order values | total_usd from clickstream.purchases, as a Histogram |
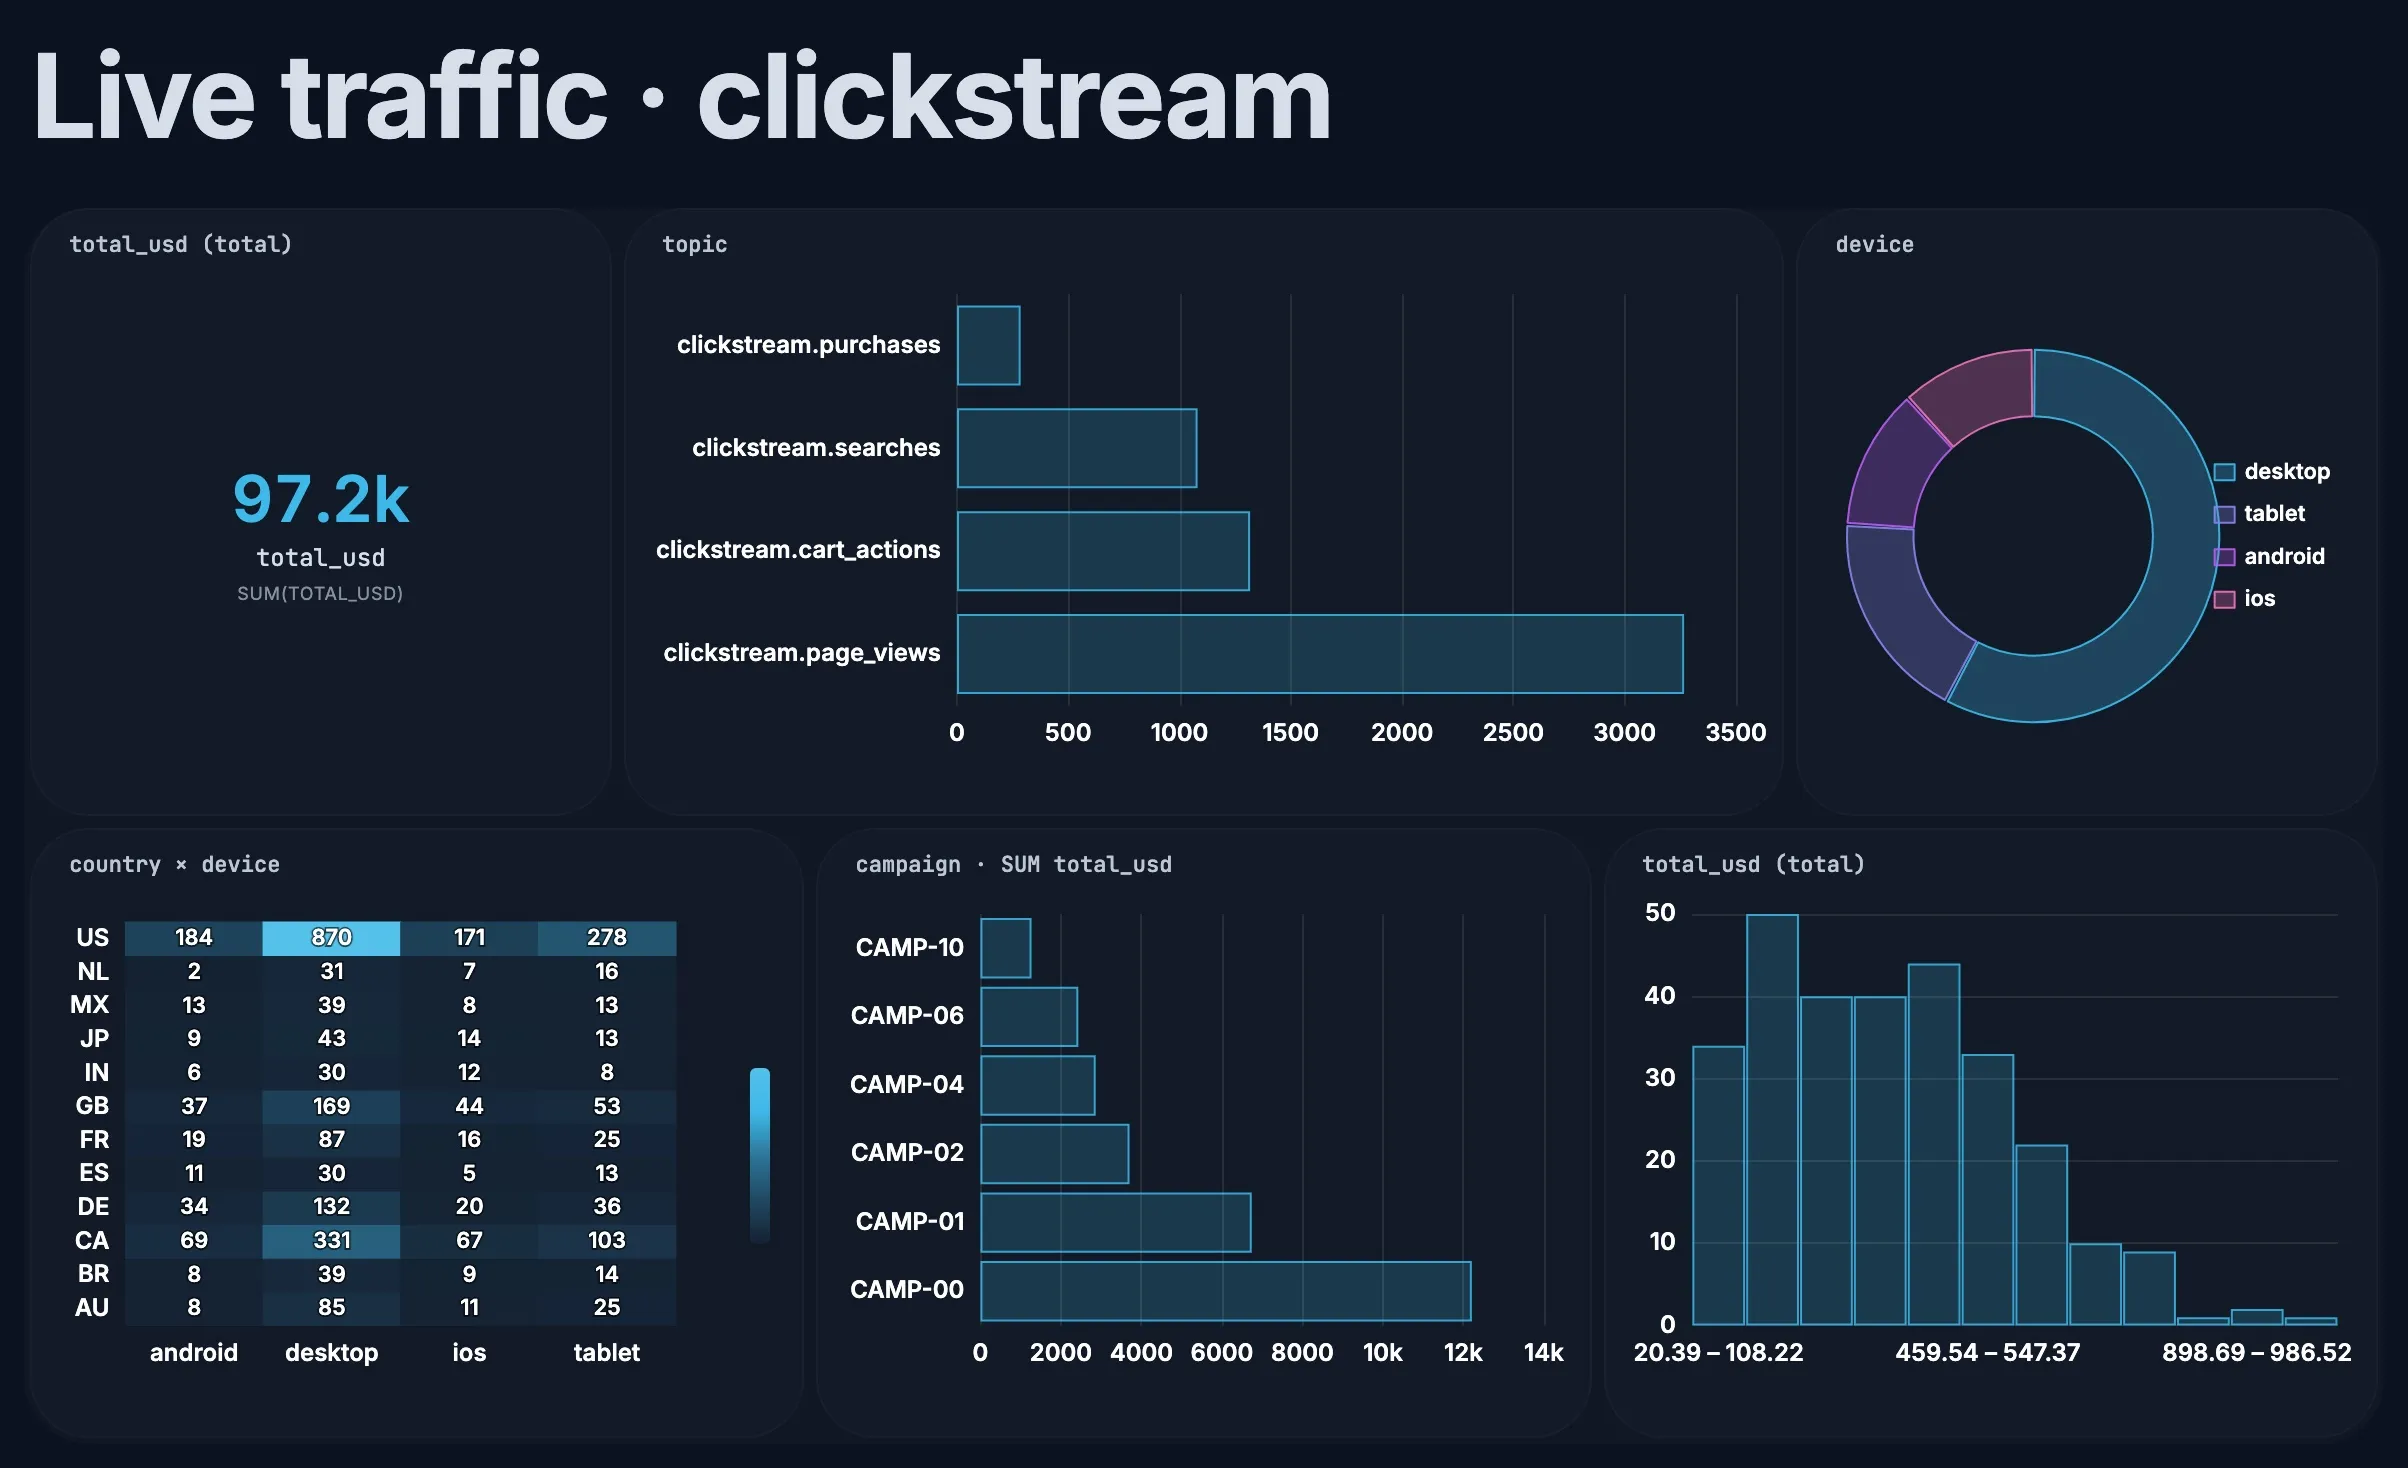
Add a title, group the cards in a container, turn on Live, and use Present for a screen in the office during a campaign launch. See Explore and charts.
4. Check traffic with a playbook
Section titled “4. Check traffic with a playbook”In Explore, choose Playbook, add a playbook, and add these queries with + SQL. Explore creates a view for each topic, such as v_clickstream_purchases, and v_messages for all of them together.
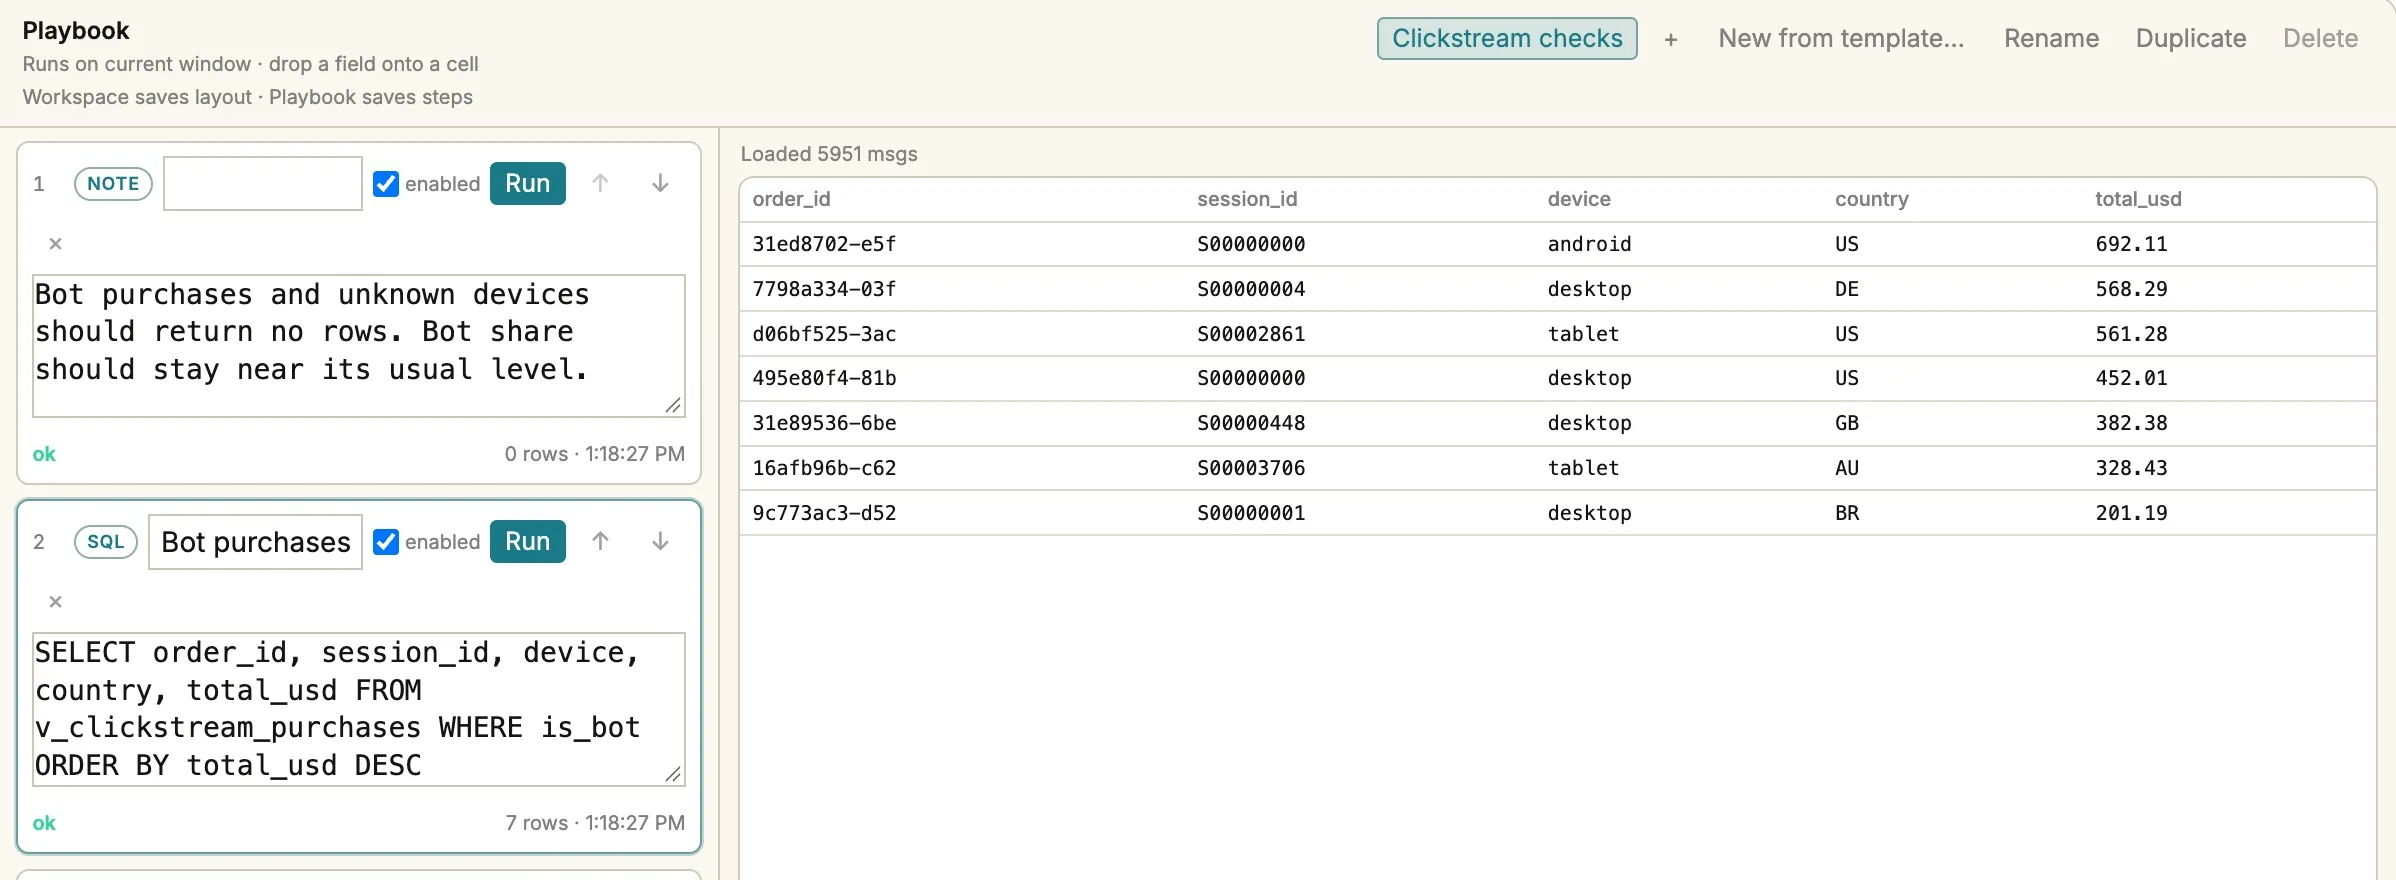
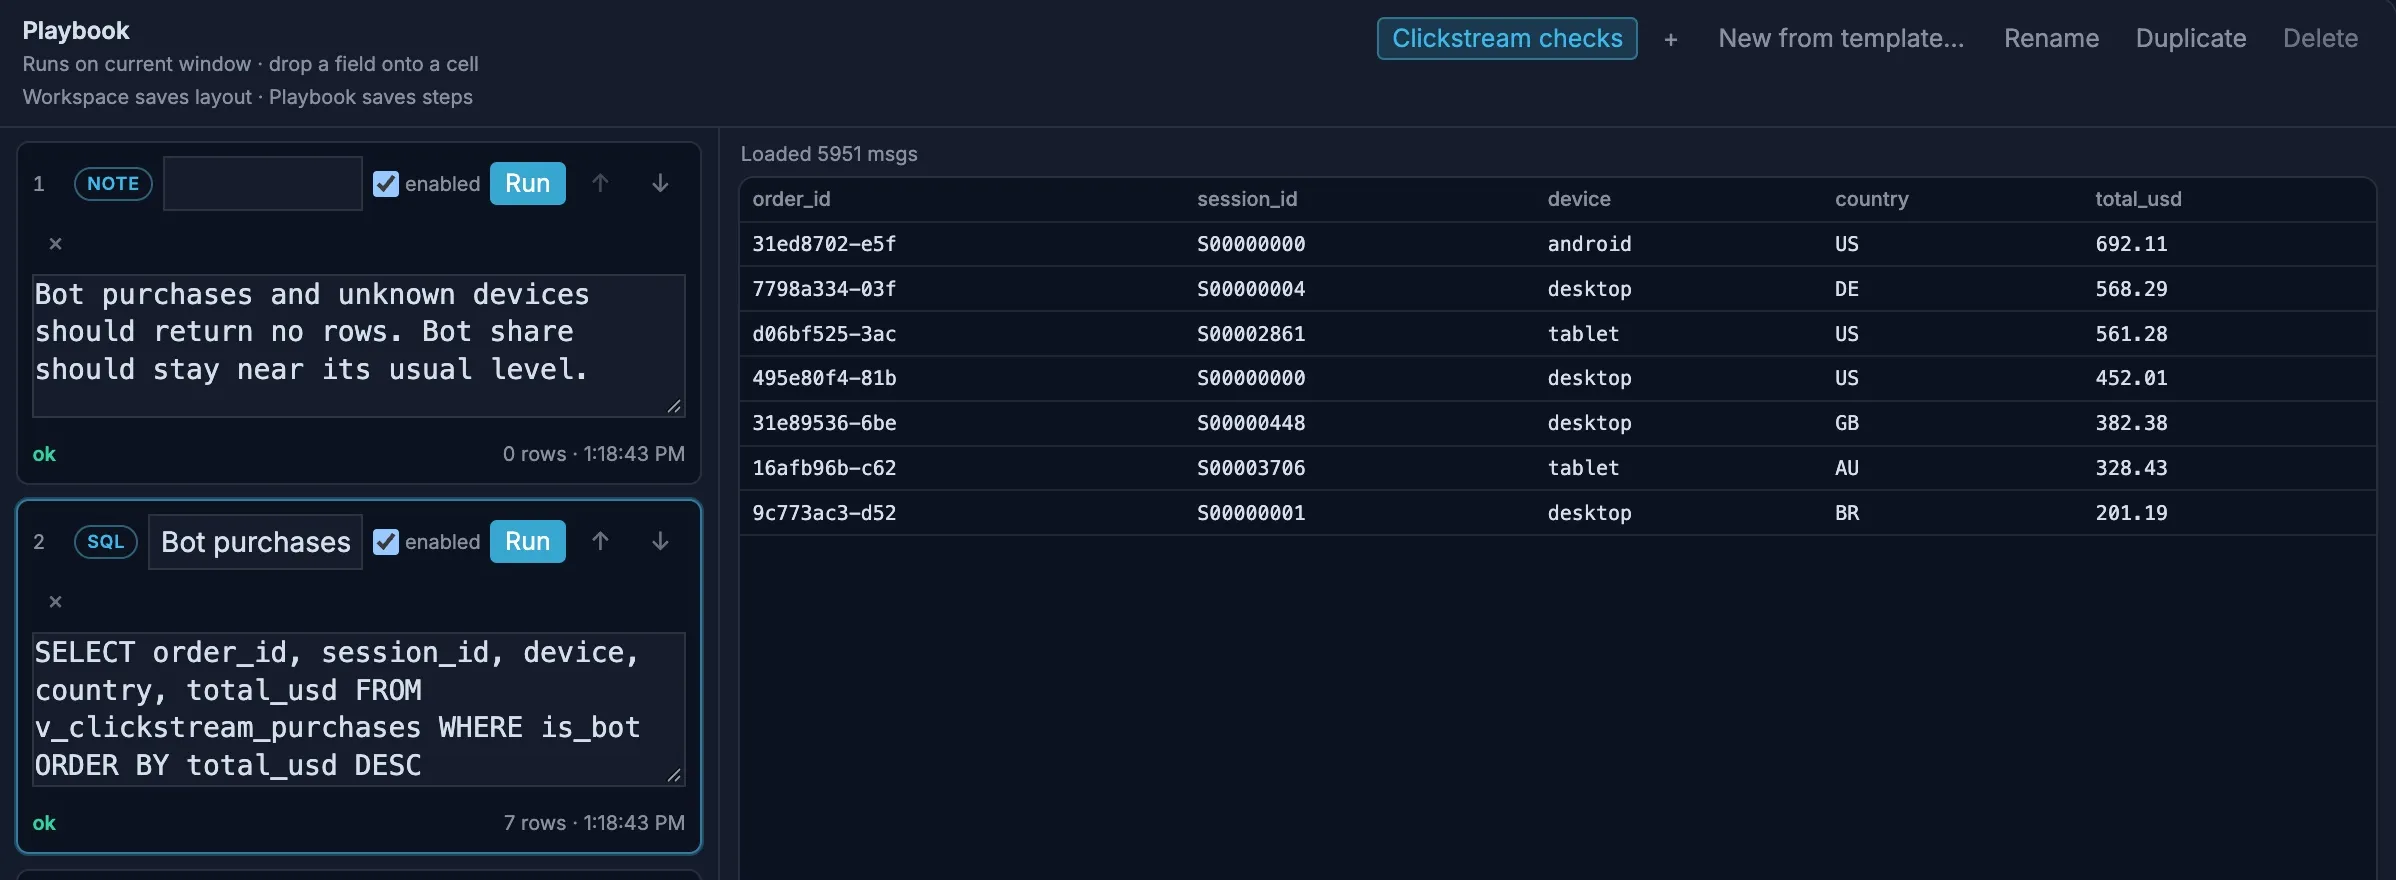
Bot purchases: bots should never complete an order.
SELECT order_id, session_id, device, country, total_usdFROM v_clickstream_purchasesWHERE is_botORDER BY total_usd DESCBot share by topic: the share of traffic that is bots, per topic.
SELECT topic, COUNT(*) AS events, round(100.0 * AVG(CASE WHEN is_bot THEN 1 ELSE 0 END), 1) AS bot_pctFROM v_messagesGROUP BY 1ORDER BY 1Unknown devices: every event should come from a known kind of device.
SELECT topic, device, COUNT(*) AS eventsFROM v_messagesWHERE device IS NULL OR device NOT IN ('ios', 'android', 'desktop', 'tablet')GROUP BY ALLFunnel: how many sessions, not counting bots, reached each step.
SELECT 'viewed' AS step, COUNT(DISTINCT session_id) AS sessions FROM v_clickstream_page_views WHERE NOT is_botUNION ALL SELECT 'searched', COUNT(DISTINCT session_id) FROM v_clickstream_searches WHERE NOT is_botUNION ALL SELECT 'added to cart', COUNT(DISTINCT session_id) FROM v_clickstream_cart_actions WHERE action = 'add_to_cart' AND NOT is_botUNION ALL SELECT 'checked out', COUNT(DISTINCT session_id) FROM v_clickstream_cart_actions WHERE action = 'checkout' AND NOT is_botUNION ALL SELECT 'purchased', COUNT(DISTINCT session_id) FROM v_clickstream_purchases WHERE NOT is_botRevenue by campaign: the top five campaigns, not counting bots.
SELECT coalesce(campaign, '(none)') AS campaign, COUNT(*) AS orders, round(SUM(total_usd)) AS revenue_usdFROM v_clickstream_purchasesWHERE NOT is_botGROUP BY 1ORDER BY revenue_usd DESCLIMIT 5Choose Run all. In the example, Unknown devices returned no rows, and bots were about 2% of every topic, from 1.9% of searches to 2.6% of cart actions. A sudden jump on one topic, such as searches, points at a scraper.
Bot purchases didn’t come back empty: it listed 7 orders, worth up to $692, which the trap had already flagged as they arrived. The playbook adds what you need to act on them: the sessions they came from, so you can block them, and the countries and devices they claimed.
The funnel showed 727 sessions viewing pages, 320 searching, 220 adding to cart, 130 checking out and 109 buying.
Keep personal data out of view
Section titled “Keep personal data out of view”Clickstream events carry user and session IDs that can be traced back to a person. Add a PII redaction profile to the four topics to replace user_id and session_id with tokens, and add a Key rule, because the message key holds the same IDs. The tokens are consistent, so the funnel’s distinct counts still work.
Next steps
Section titled “Next steps”- Follow one session: copy a
session_idfrom a bot event and add a trap onkey == "…"to collect every page view, search and cart action from that session. - On a very busy site, sample: set Sample every on the source, or use the high_volume preset in Settings. Traps then check the sample, not every event.