

Event-driven order pipeline
In an event-driven system, services don’t call each other: each one reads events from Kafka, does its job, and writes a new event for the next service. It keeps services independent, but it makes one question hard to answer: did every order make it through? An order stuck between two services doesn’t throw an error. It just stops.
Akema reads every topic in the pipeline at once, catches the events that need attention, and checks across topics that each order took the right path.
The example
Section titled “The example”An order passes through four services, each writing to its own topic. A fifth service sends customer notifications for each step.
| Topic | Written by | Events |
|---|---|---|
orders.created |
Order service | A new order, with its line items and total |
orders.payments |
Payment service | captured, or failed with a reason |
orders.inventory |
Inventory service | reserved, or backorder |
orders.shipments |
Shipping service | shipped, then delivered |
orders.notifications |
Notification service | An email, SMS or push message for each step |
Every event is keyed by order_id, so all of an order’s events land in the same partition of each topic.
The rules: a failed payment must stop the order, so it is never reserved or shipped, and a backordered order must not ship.
1. Connect
Section titled “1. Connect”On Connect, add one source for your cluster with all five topics. One source keeps the pipeline together: one pill in the stream bar, and one set of topic tabs in Inspect.
2. Trap what needs attention
Section titled “2. Trap what needs attention”Add these traps. Each one checks the topic first, because fields such as status mean different things on different topics.
| Trap | Expression | Catches |
|---|---|---|
payment_failed |
topic == "orders.payments" && value_json.status == "failed" |
Declined or failed payments |
backorder |
topic == "orders.inventory" && value_json.status == "backorder" |
Orders waiting for stock |
large_order |
topic == "orders.created" && value_json.total_cents > 200000 |
Orders over $2,000, worth a second look |
In 500 orders, Akema caught 24 failed payments, 47 backorders and 7 large orders.
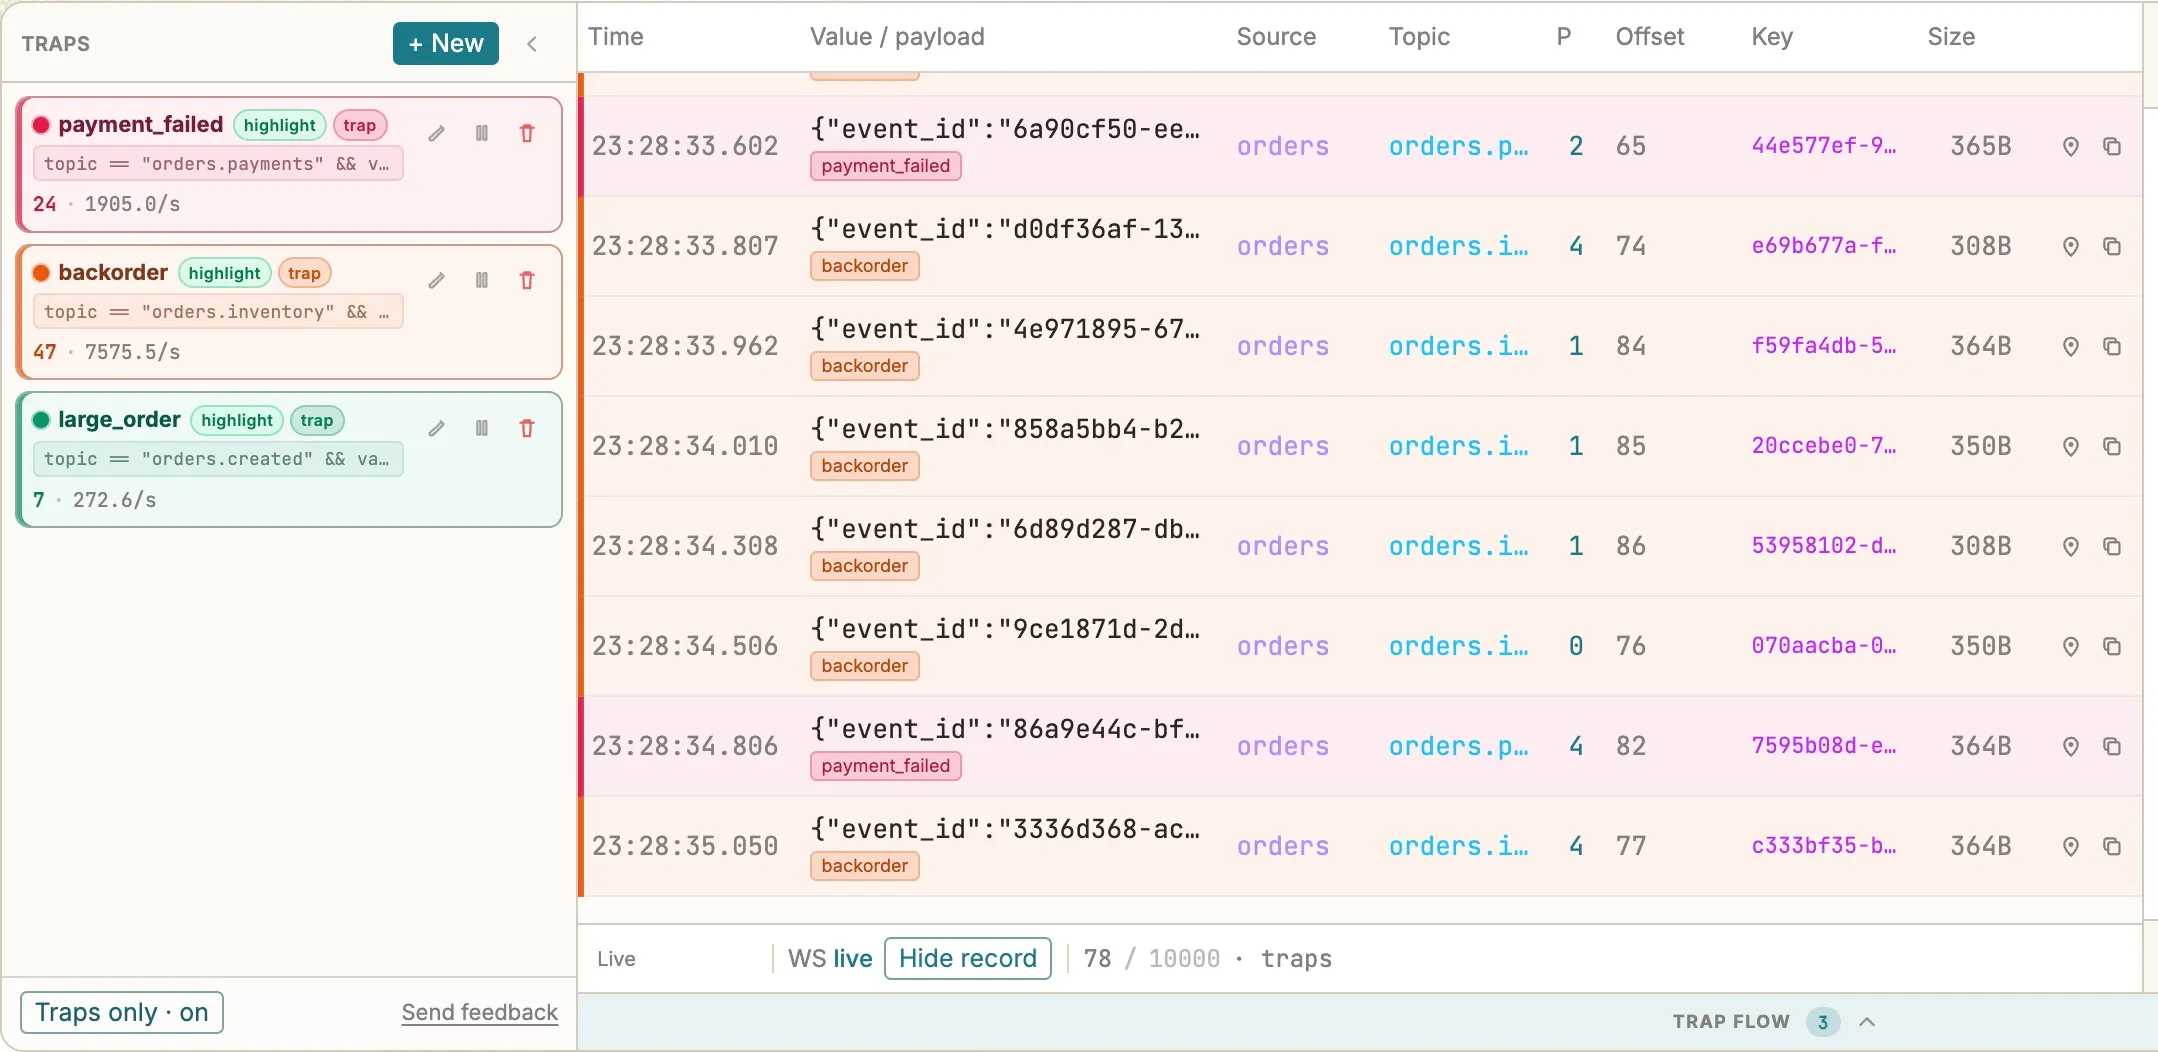
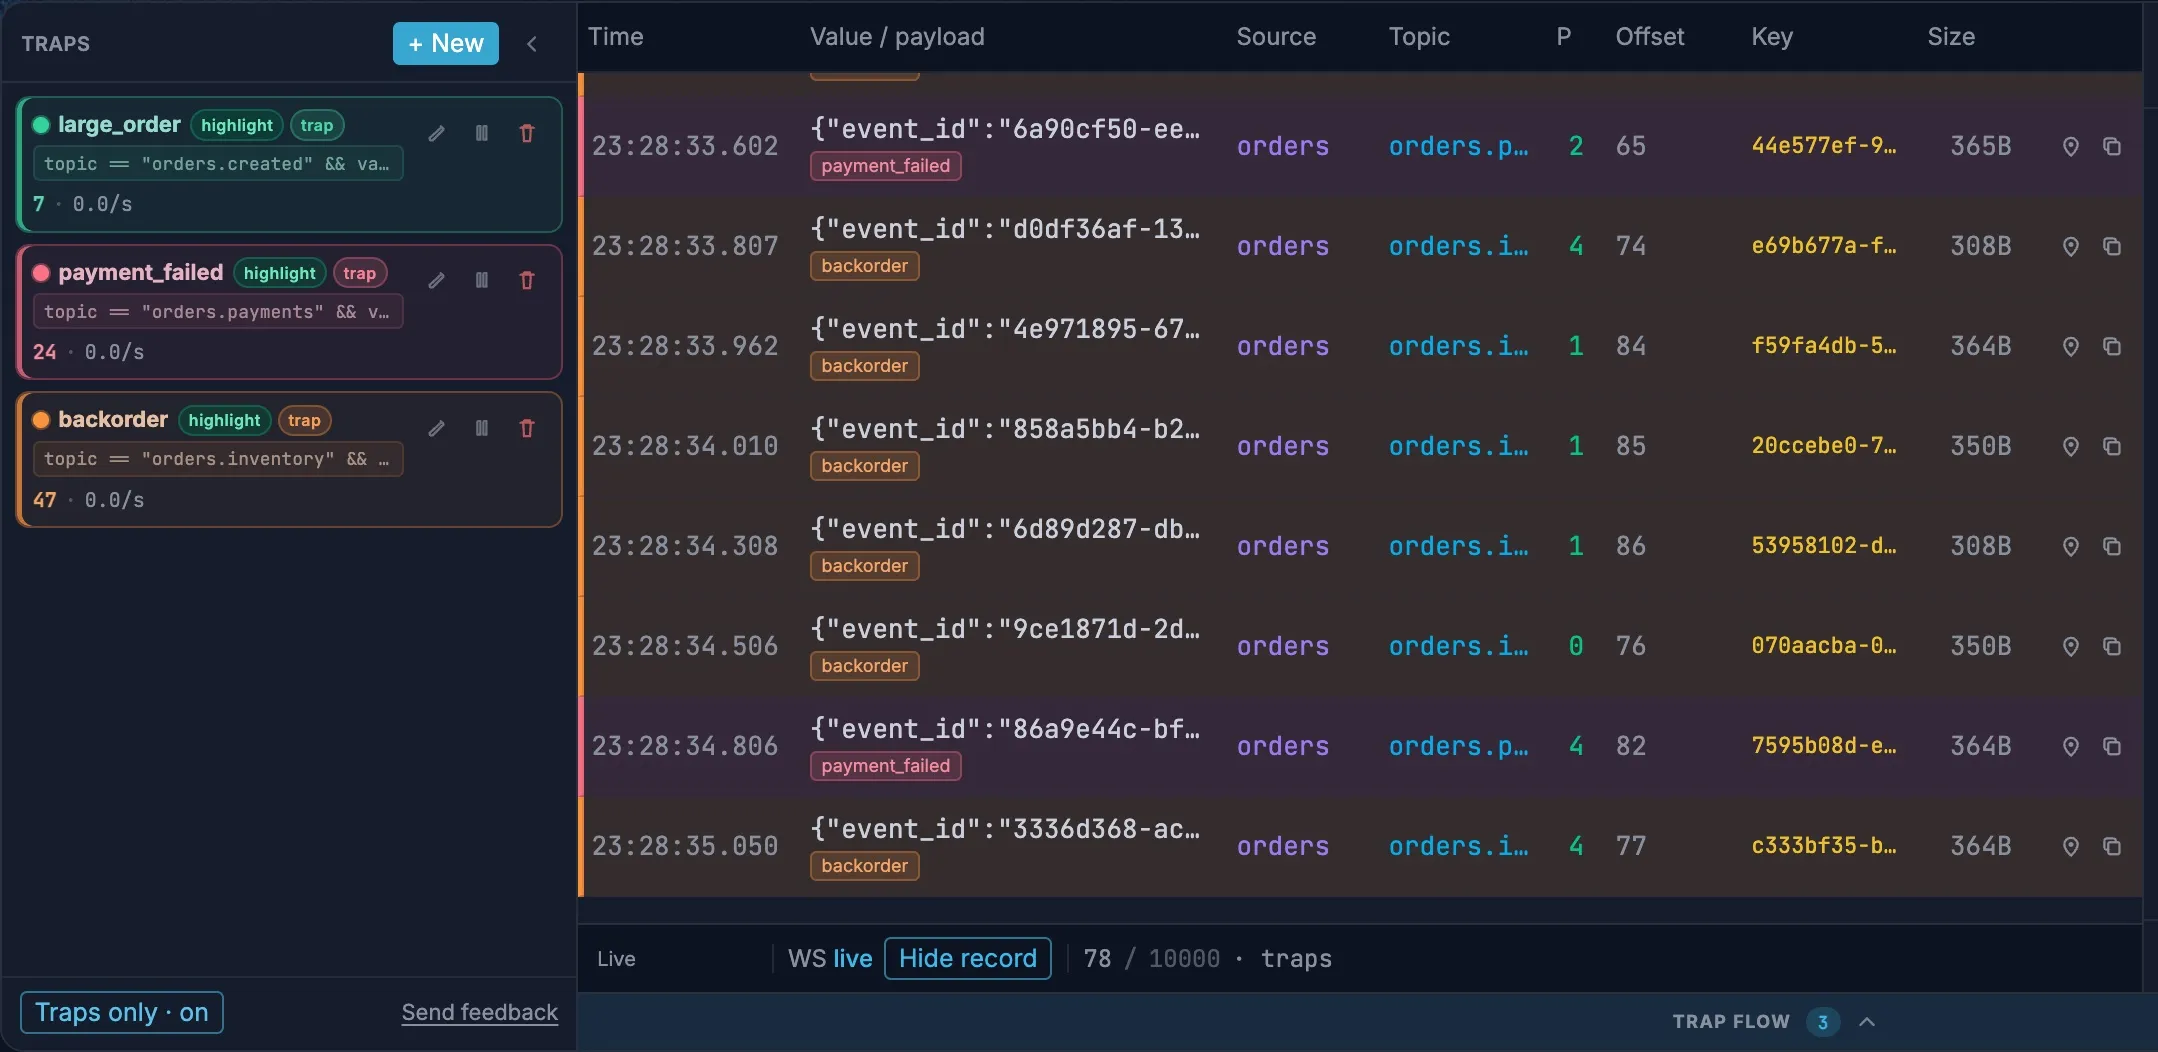
To follow one order through the pipeline, copy its order_id from any event and add a trap on key == "…". Every event for that order, on every topic, is tagged as it arrives.
3. See where failures come from
Section titled “3. See where failures come from”Explore charts the pipeline so you can see how orders flow and where they stop. Choose Load to start.
Click through to the cause
Section titled “Click through to the cause”- Drag
statusfromorders.paymentsonto the canvas, and clickfailed. - Drag
payment_methodfromorders.paymentsnext to it. - Drag
failure_reasonto see why the payments failed.
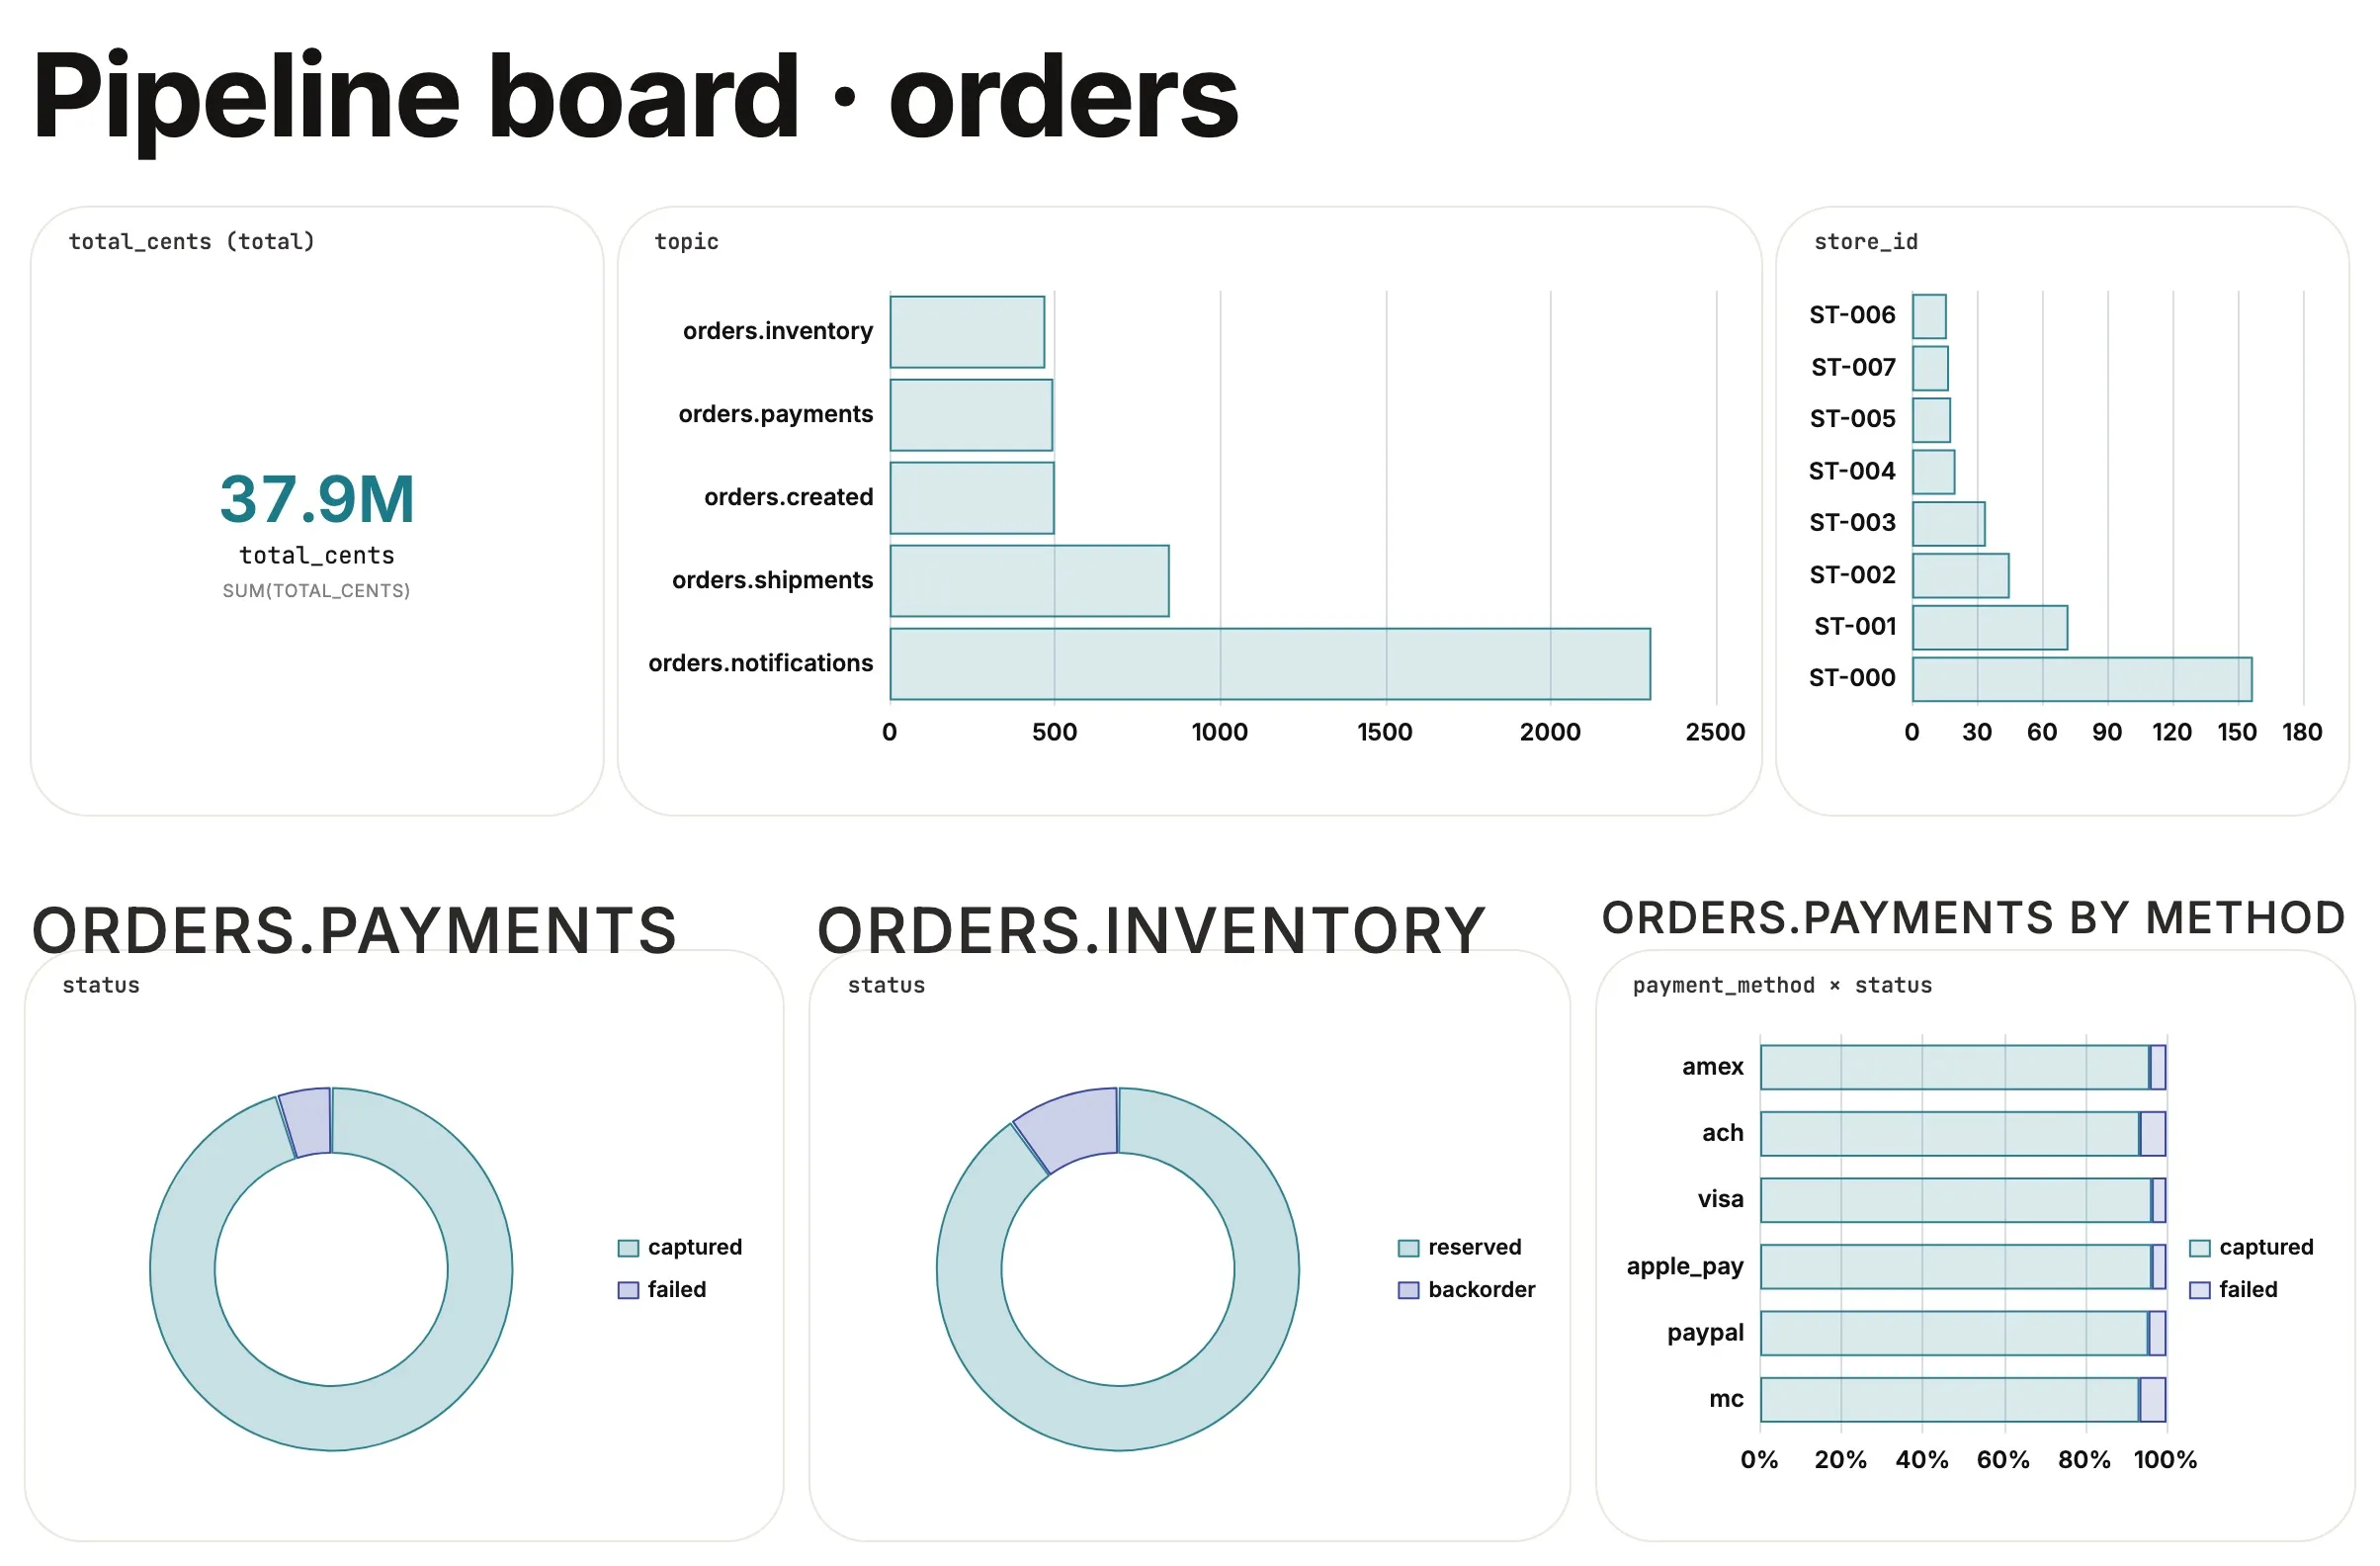
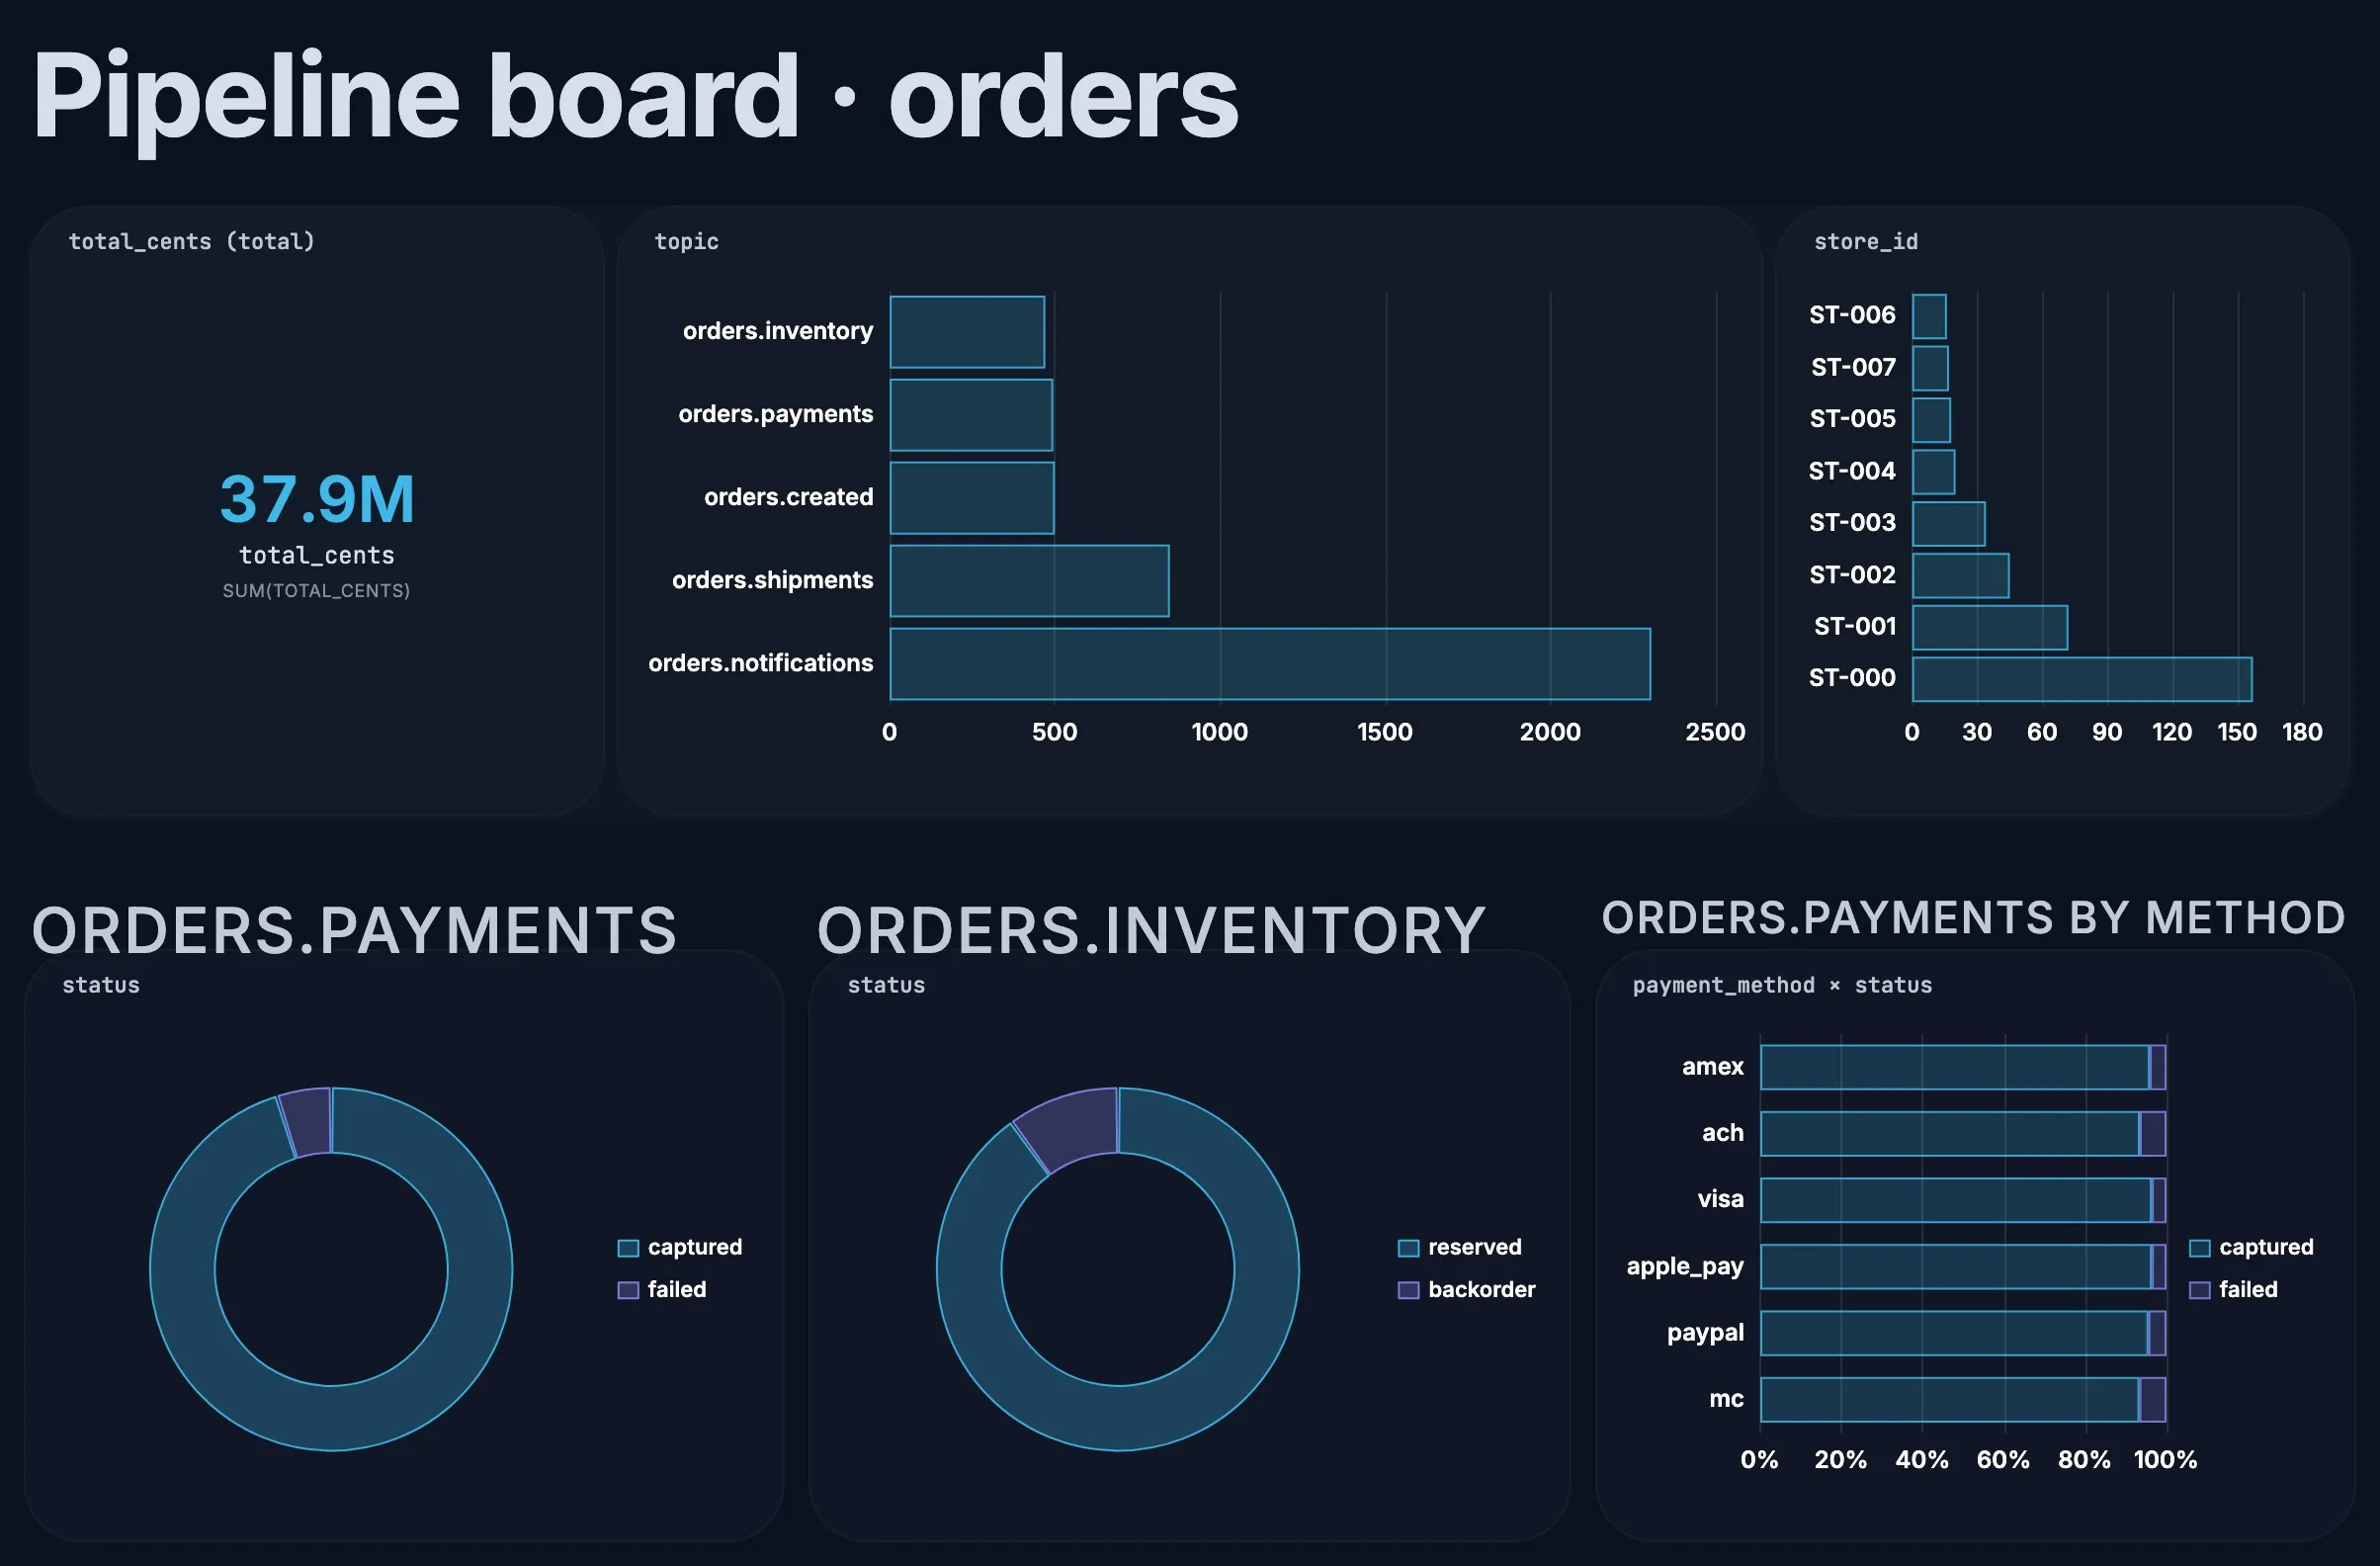
In the example, Mastercard and ACH failed most often, at about 7%, against under 4% for Visa and Apple Pay. That’s 6 and 5 failed payments against 3 each, though, and with a couple of dozen failures in a window, gaps that small are chance. Reload a longer window before you act on one. A method that keeps failing at several times the rate of the others points at that payment provider, not your code.
To compare methods side by side, click failed again to clear it, drop status onto the payment_method chart, and choose Stacked bar. Maximize the chart with ⛶ and set Stack mode to Percent: each bar becomes 100%, and the failed slice shows each method’s failure rate directly.
See the pipeline as a funnel
Section titled “See the pipeline as a funnel”Each step of the pipeline writes to its own topic, so a chart of topic is a funnel. Click failed again to clear it, then drag topic from Envelope onto the canvas, choose Horizontal bar, and sort by value.
In the example, the bars read 500 orders created, 495 payments, 471 inventory decisions and 848 shipment events, plus 2,305 notifications. Each step accounts for the one before it: the 24 failed payments never reach inventory (495 − 24 = 471), and the 47 backorders never ship, which leaves 424 orders with two shipment events each, shipped and delivered. The 5 orders between created and paid are the ones the playbook below finds still waiting.
To see the outcome at each step, drag status from orders.payments, orders.inventory and orders.shipments, choose Donut for each, and group them side by side. A step whose donut changes shape, such as backorders doubling, is where the pipeline needs attention.
See who’s ordering what
Section titled “See who’s ordering what”- Stores: drag
store_idfromorders.created, as a Horizontal bar. In the example, one store took about 30% of all orders and the top three about half, so a problem at one store shows up fast. - Order values: drag
total_centsand choose Histogram. Most orders were under $1,250, with a thin tail past $2,000: the orders thelarge_ordertrap catches. - Revenue: drag
total_centsonto empty canvas for a KPI, with SUM as the metric. It’s in cents, as the topic sends it.
Build a pipeline board
Section titled “Build a pipeline board”Put the funnel, the status donuts, the payment-method chart, stores and revenue on one canvas, with a text block for the title. Select the charts and choose Group to put them in a container, turn on Live, and use Present for a screen the team can watch through a launch or a sale. Clicking failed filters the charts from orders.payments to failed payments; charts from other topics don’t have that field, so they stay as they are. Charts of Envelope fields, such as the topic funnel, follow every filter, so they narrow to failed payments too. See Explore and charts.
4. Prove no order skipped a step
Section titled “4. Prove no order skipped a step”The most useful checks join topics on order_id. In Explore, choose Playbook, add a playbook, and add these queries with + SQL. Explore creates a view for each topic, such as v_orders_payments.
Never paid: orders with no payment event.
SELECT c.order_id, strftime(c.event_ts, '%H:%M:%S') AS created_atFROM v_orders_created cLEFT JOIN v_orders_payments p USING (order_id)WHERE p.order_id IS NULLORDER BY c.event_tsFailed but reserved: a failed payment must stop the order.
SELECT p.order_idFROM v_orders_payments pJOIN v_orders_inventory i USING (order_id)WHERE p.status = 'failed'Backordered but shipped: a backordered order must not ship.
SELECT i.order_idFROM v_orders_inventory iJOIN v_orders_shipments s USING (order_id)WHERE i.status = 'backorder'Funnel: how many orders reached each step.
SELECT 'created' AS stage, COUNT(DISTINCT order_id) AS orders FROM v_orders_createdUNION ALL SELECT 'paid', COUNT(DISTINCT order_id) FROM v_orders_payments WHERE status = 'captured'UNION ALL SELECT 'reserved', COUNT(DISTINCT order_id) FROM v_orders_inventory WHERE status = 'reserved'UNION ALL SELECT 'delivered', COUNT(DISTINCT order_id) FROM v_orders_shipments WHERE status = 'delivered'Choose Run all. The two rule checks should return no rows, and in the example they didn’t: no failed payment was reserved and no backorder shipped. The funnel showed 500 orders created, 471 paid, and 424 reserved and delivered.
The Never paid check found 5 orders. Their creation times show why: four were the very first orders, created before the payment service was listening, and one was the very last, still in flight when the window was loaded. Those are exactly the orders a real outage would strand, which is why this check belongs in every playbook.
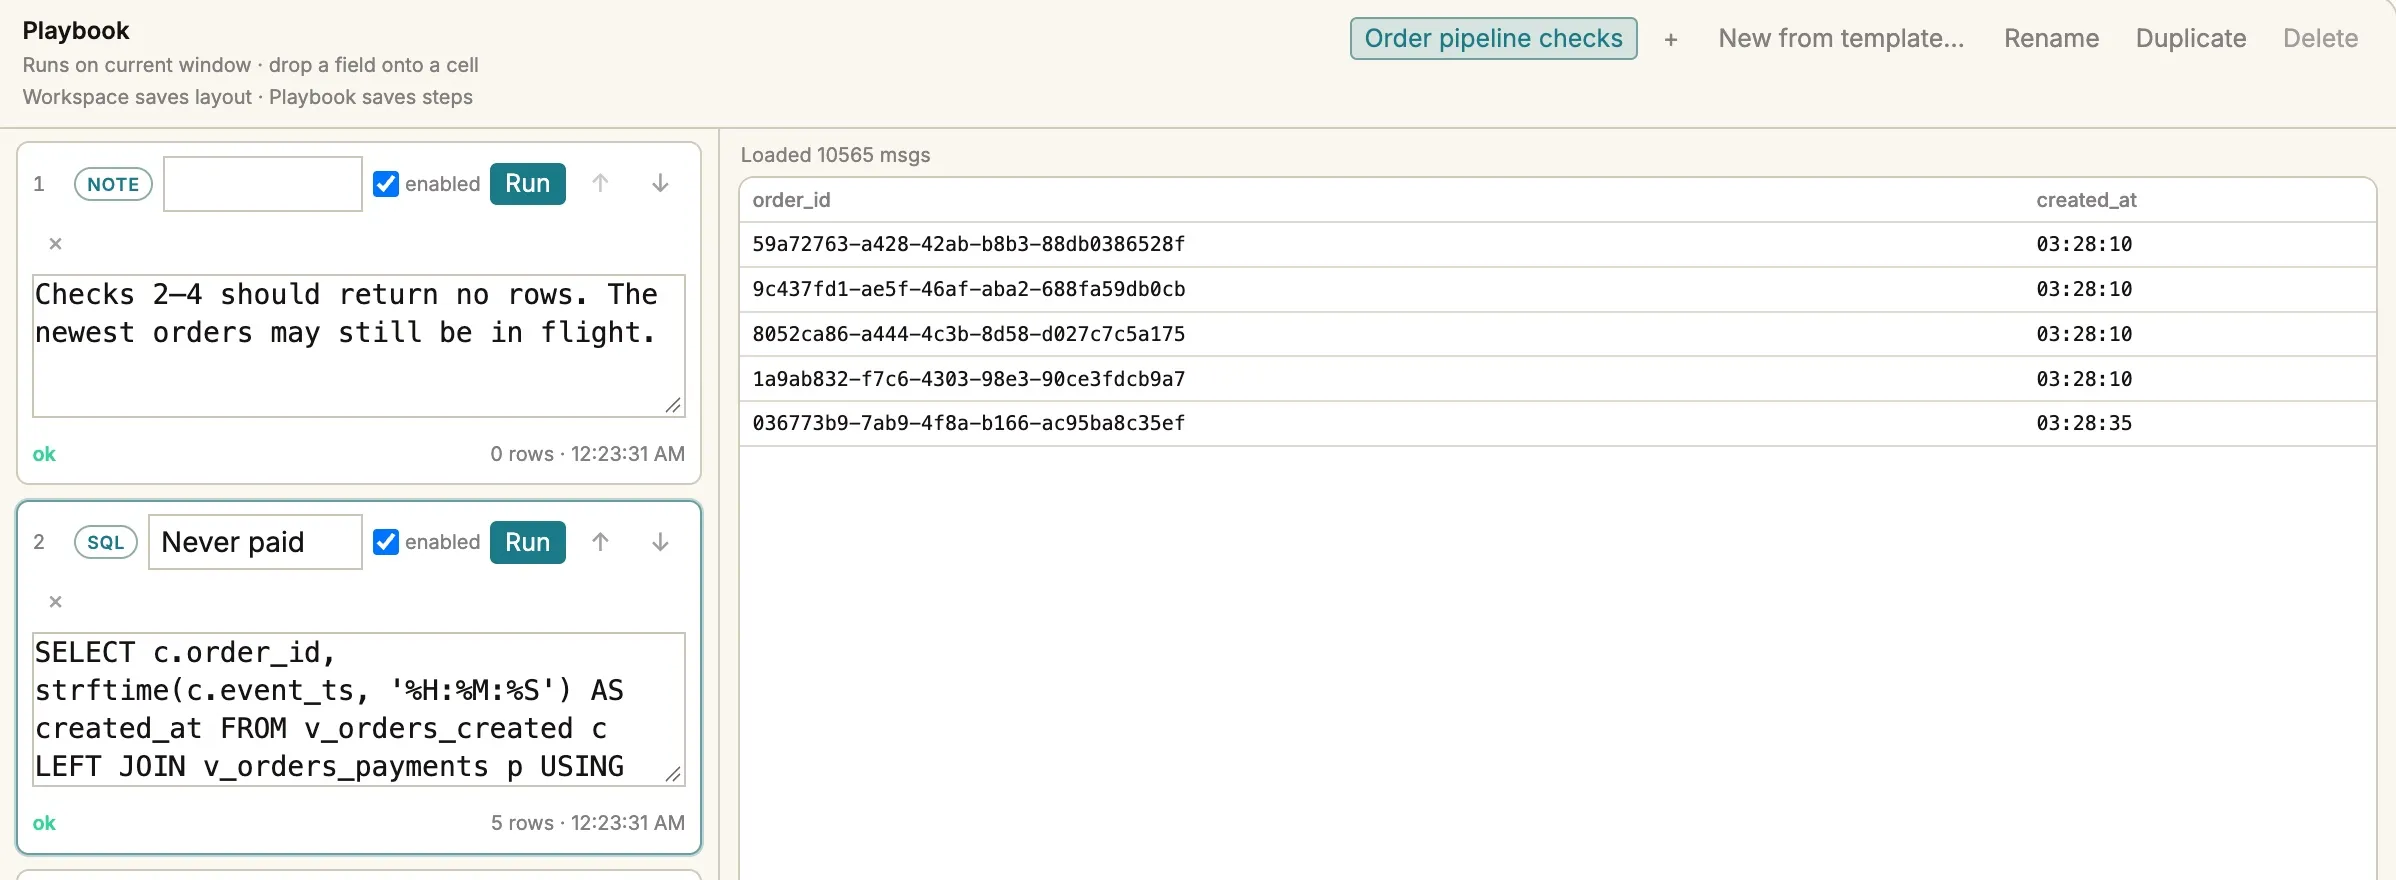
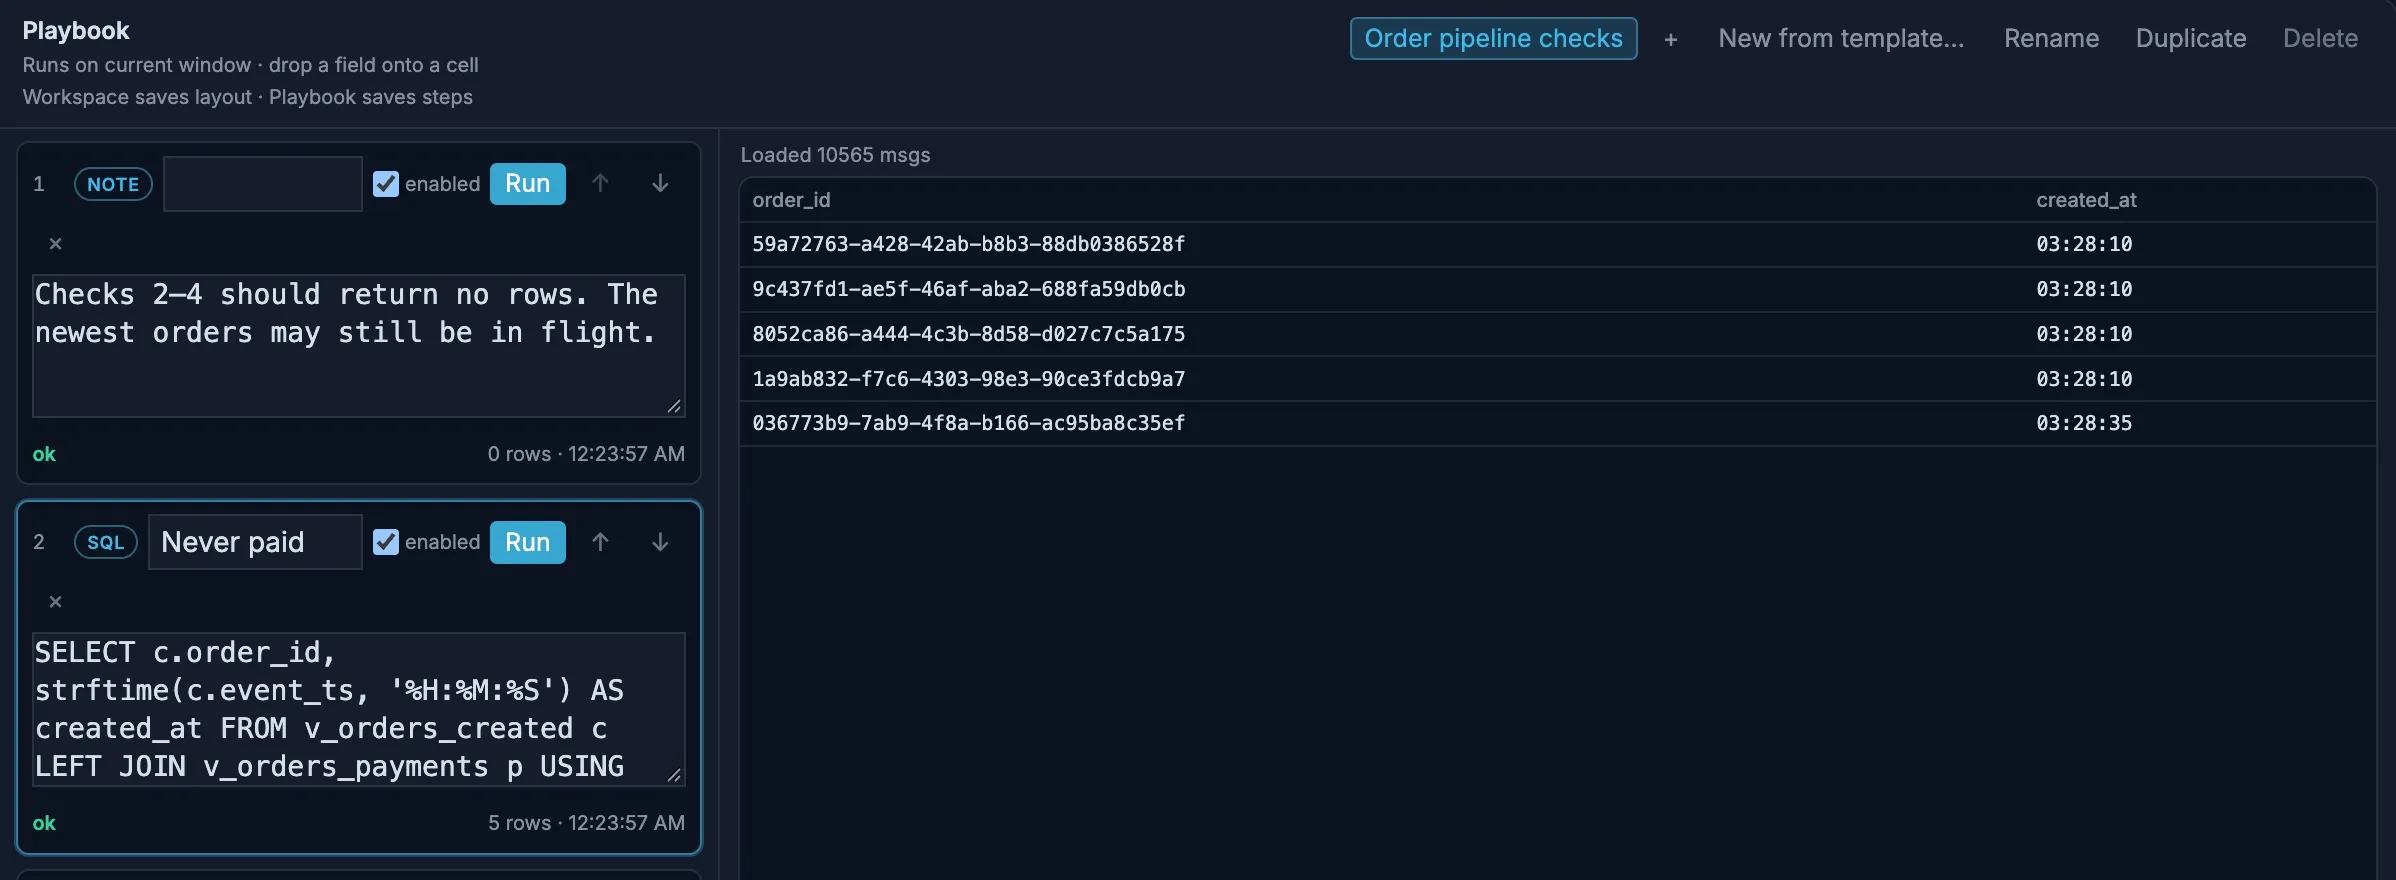
Orders created in the last few seconds of a window can still be in flight. If the newest orders show up as never paid, Reload and run the playbook again.
Keep personal data out of view
Section titled “Keep personal data out of view”Order events carry customer IDs and shipping postcodes. Add a PII redaction profile to orders.created and orders.shipments to replace customer_id and shipping_zip with tokens. Joins on order_id keep working, and the tokens are consistent, so you can still count orders per customer.
Next steps
Section titled “Next steps”- Watch a launch or a sale: leave the pipeline board on Live, so a failure rate that climbs shows on screen while it’s happening, not in tomorrow’s report.
- Catch stuck orders: a trap can’t see that an event is missing, so Reload and Run all regularly while you watch the pipeline.