

Log aggregation
Many teams send application logs through Kafka instead of shipping log files: each service writes structured log lines to a topic, and indexers, alerting and archiving read from there. When something goes wrong, the answer is in those topics, often minutes before it reaches a dashboard.
Akema lets you watch the log topics directly, catch the lines that matter as they arrive, and ask where they’re coming from, without waiting for an indexer or writing a consumer.
The example
Section titled “The example”Five services (checkout-api, inventory-svc, payments-svc, identity-svc and search-svc) each write JSON log lines to their own topic, such as logs.checkout-api, and also to a shared topic, logs.application. Identity and payments also write security events to logs.audit. Every line is keyed by its request’s trace_id.
A log line looks like this:
{ "level": "ERROR", "service": "search-svc", "instance_id": "search-svc-1", "trace_id": "43d9fd9c-3fda-4130-a168-a4d7d7a2ed10", "http_route": "/v1/search", "http_status": 500, "latency_ms": 312, "error_code": "DB_DEADLOCK", "message": "upstream error on /v1/search"}Every so often, one instance starts failing and floods the topic with errors for a few seconds. Errors also happen at a low rate everywhere, so the burst is hidden unless you look for it.
1. Connect
Section titled “1. Connect”On Connect, add a source for your cluster and choose logs.application and logs.audit as its topics. Reading the shared topic covers every service; add the per-service topics instead if you only care about some of them.
To watch only new lines, set Start mode to Latest (tail). To look back at an incident, use Timestamp with a start time. See Connect to Kafka.
2. Trap what matters
Section titled “2. Trap what matters”In the Traps panel, add these traps:
| Trap | Expression | Catches |
|---|---|---|
errors |
value_json.level == "ERROR" |
Every error line |
slow_requests |
value_json.latency_ms > 300 |
Requests slower than 300 ms |
privilege_grants |
value_json.action == "privilege_grant" |
Users given new permissions (from logs.audit) |
unexpected_audit_source |
topic == "logs.audit" && !(value_json.service in ["identity-svc", "payments-svc"]) |
Security events from a service that shouldn’t write them |
Each trap colors its matches in the table and keeps a running count. In a minute of traffic at about 100 lines a second, Akema caught 373 errors, 41 slow requests and 15 privilege grants, and, as it should be, no audit events from an unexpected service.
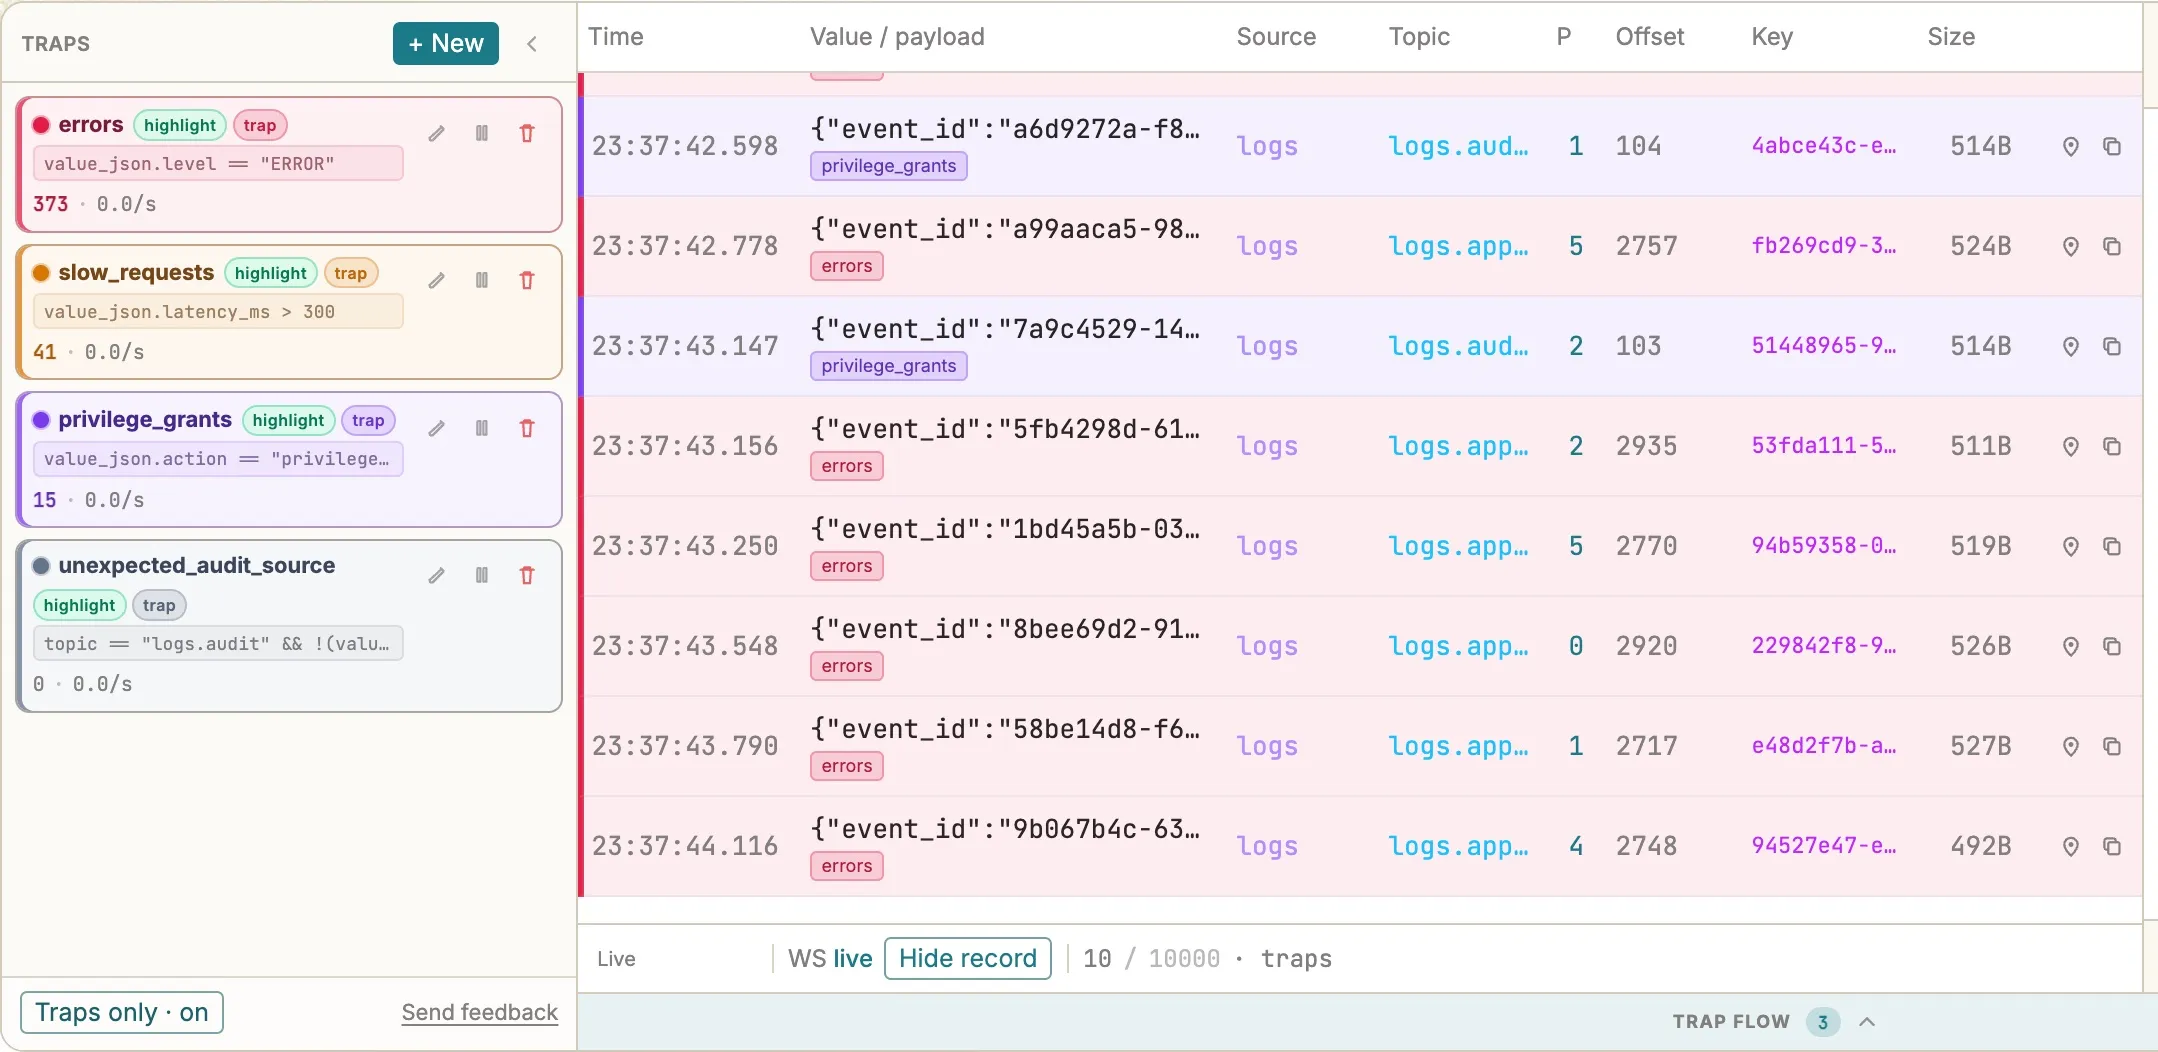
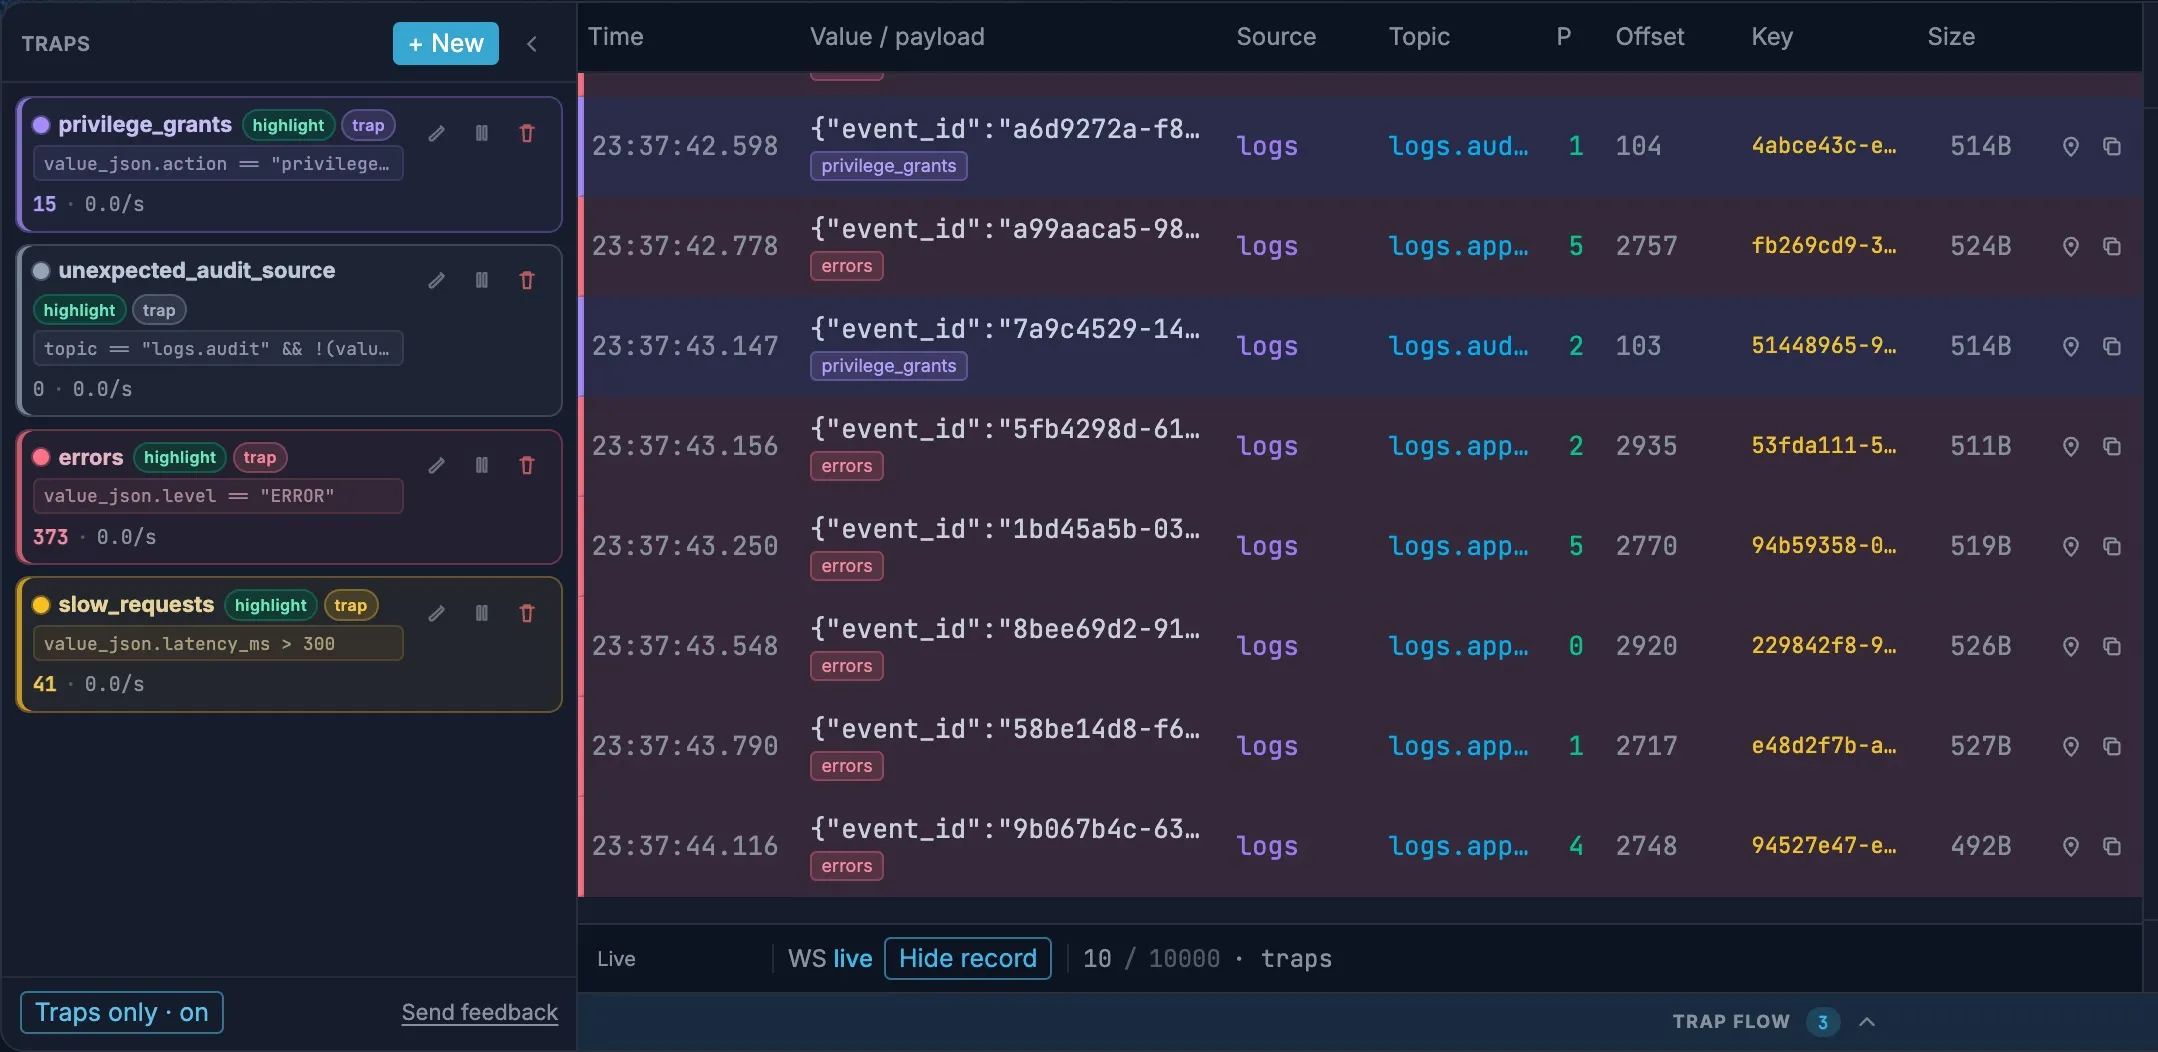
Turn on Traps only to keep just the matching lines in the table on a busy topic. Click a trap to see only its matches.
3. Find the noisy instance
Section titled “3. Find the noisy instance”373 errors is a number, not an answer. Explore charts the window so you can see where they come from and when. Open Explore and choose Load.
Click through to the cause
Section titled “Click through to the cause”- Drag
levelonto the canvas, and click theERRORbar. Every chart you add now shows errors only. - Drag
instance_idonto the canvas to see errors per instance. - Drag
error_codenext to it to see what kind of errors they are.
Most instances log a steady trickle of errors. An instance that had a burst stands above the rest. Click it, and the error_code chart shows what it was failing on.
See when it happened
Section titled “See when it happened”A total per instance hides the shape of a burst. Drag time from Envelope onto the canvas: with ERROR still selected, you get a line of errors per second.
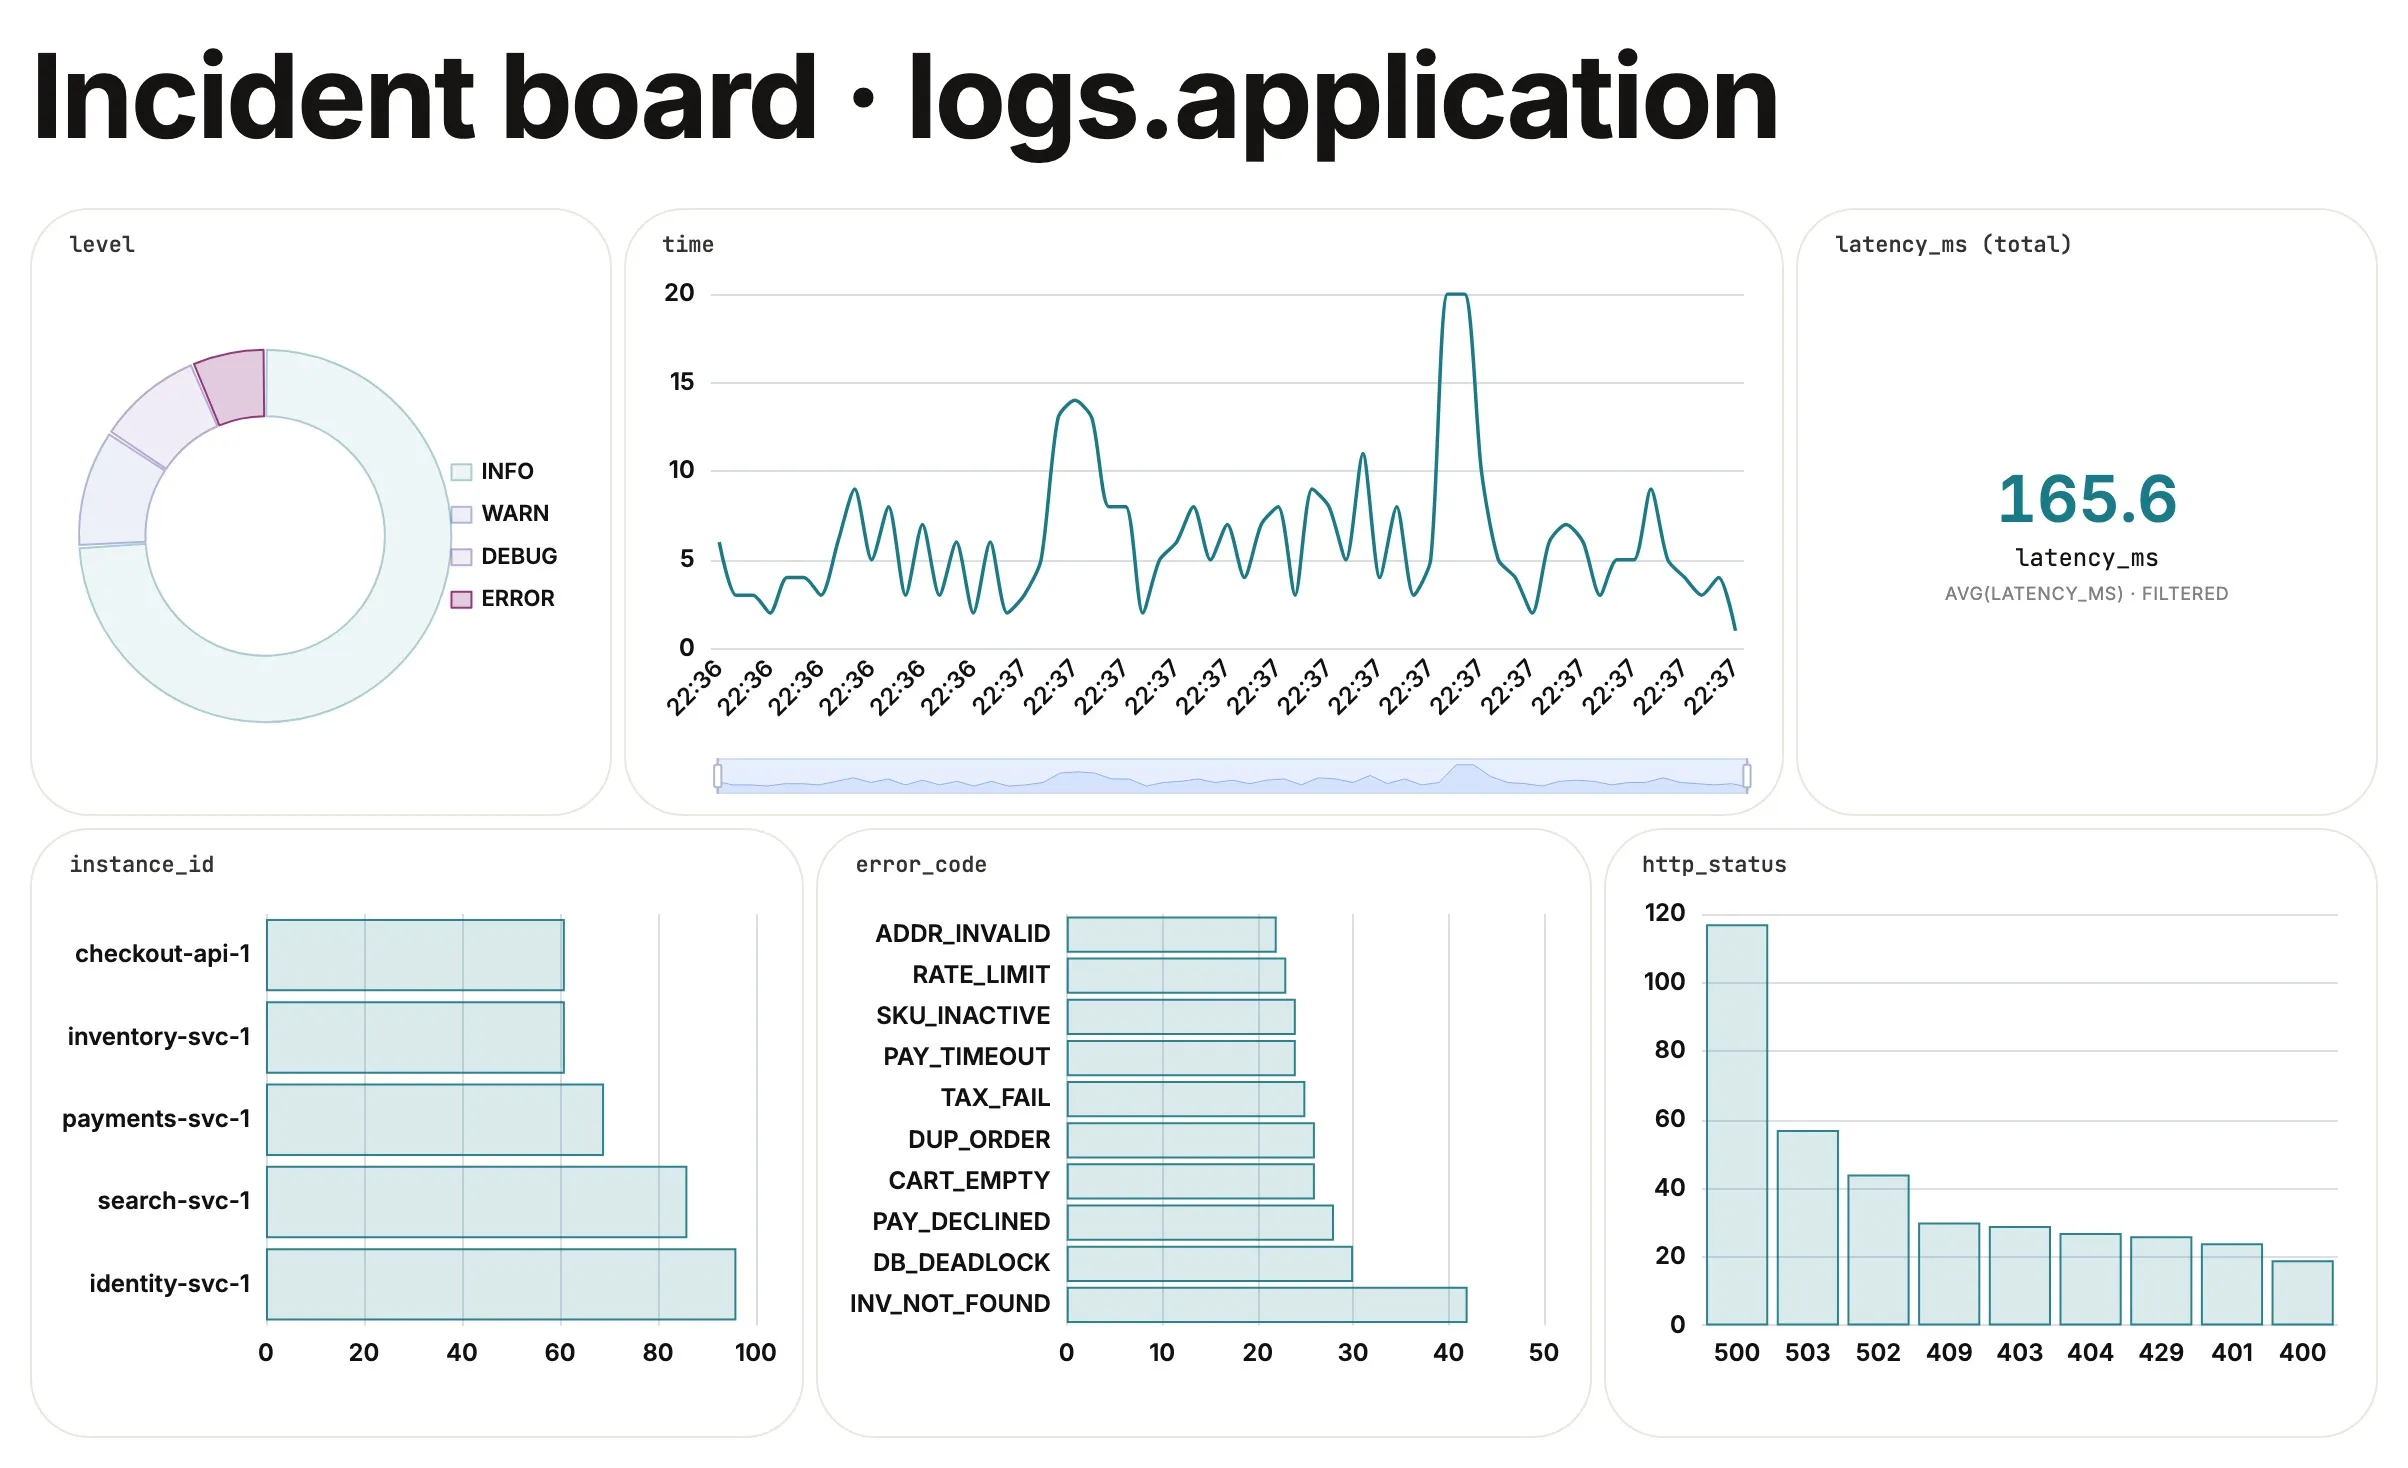
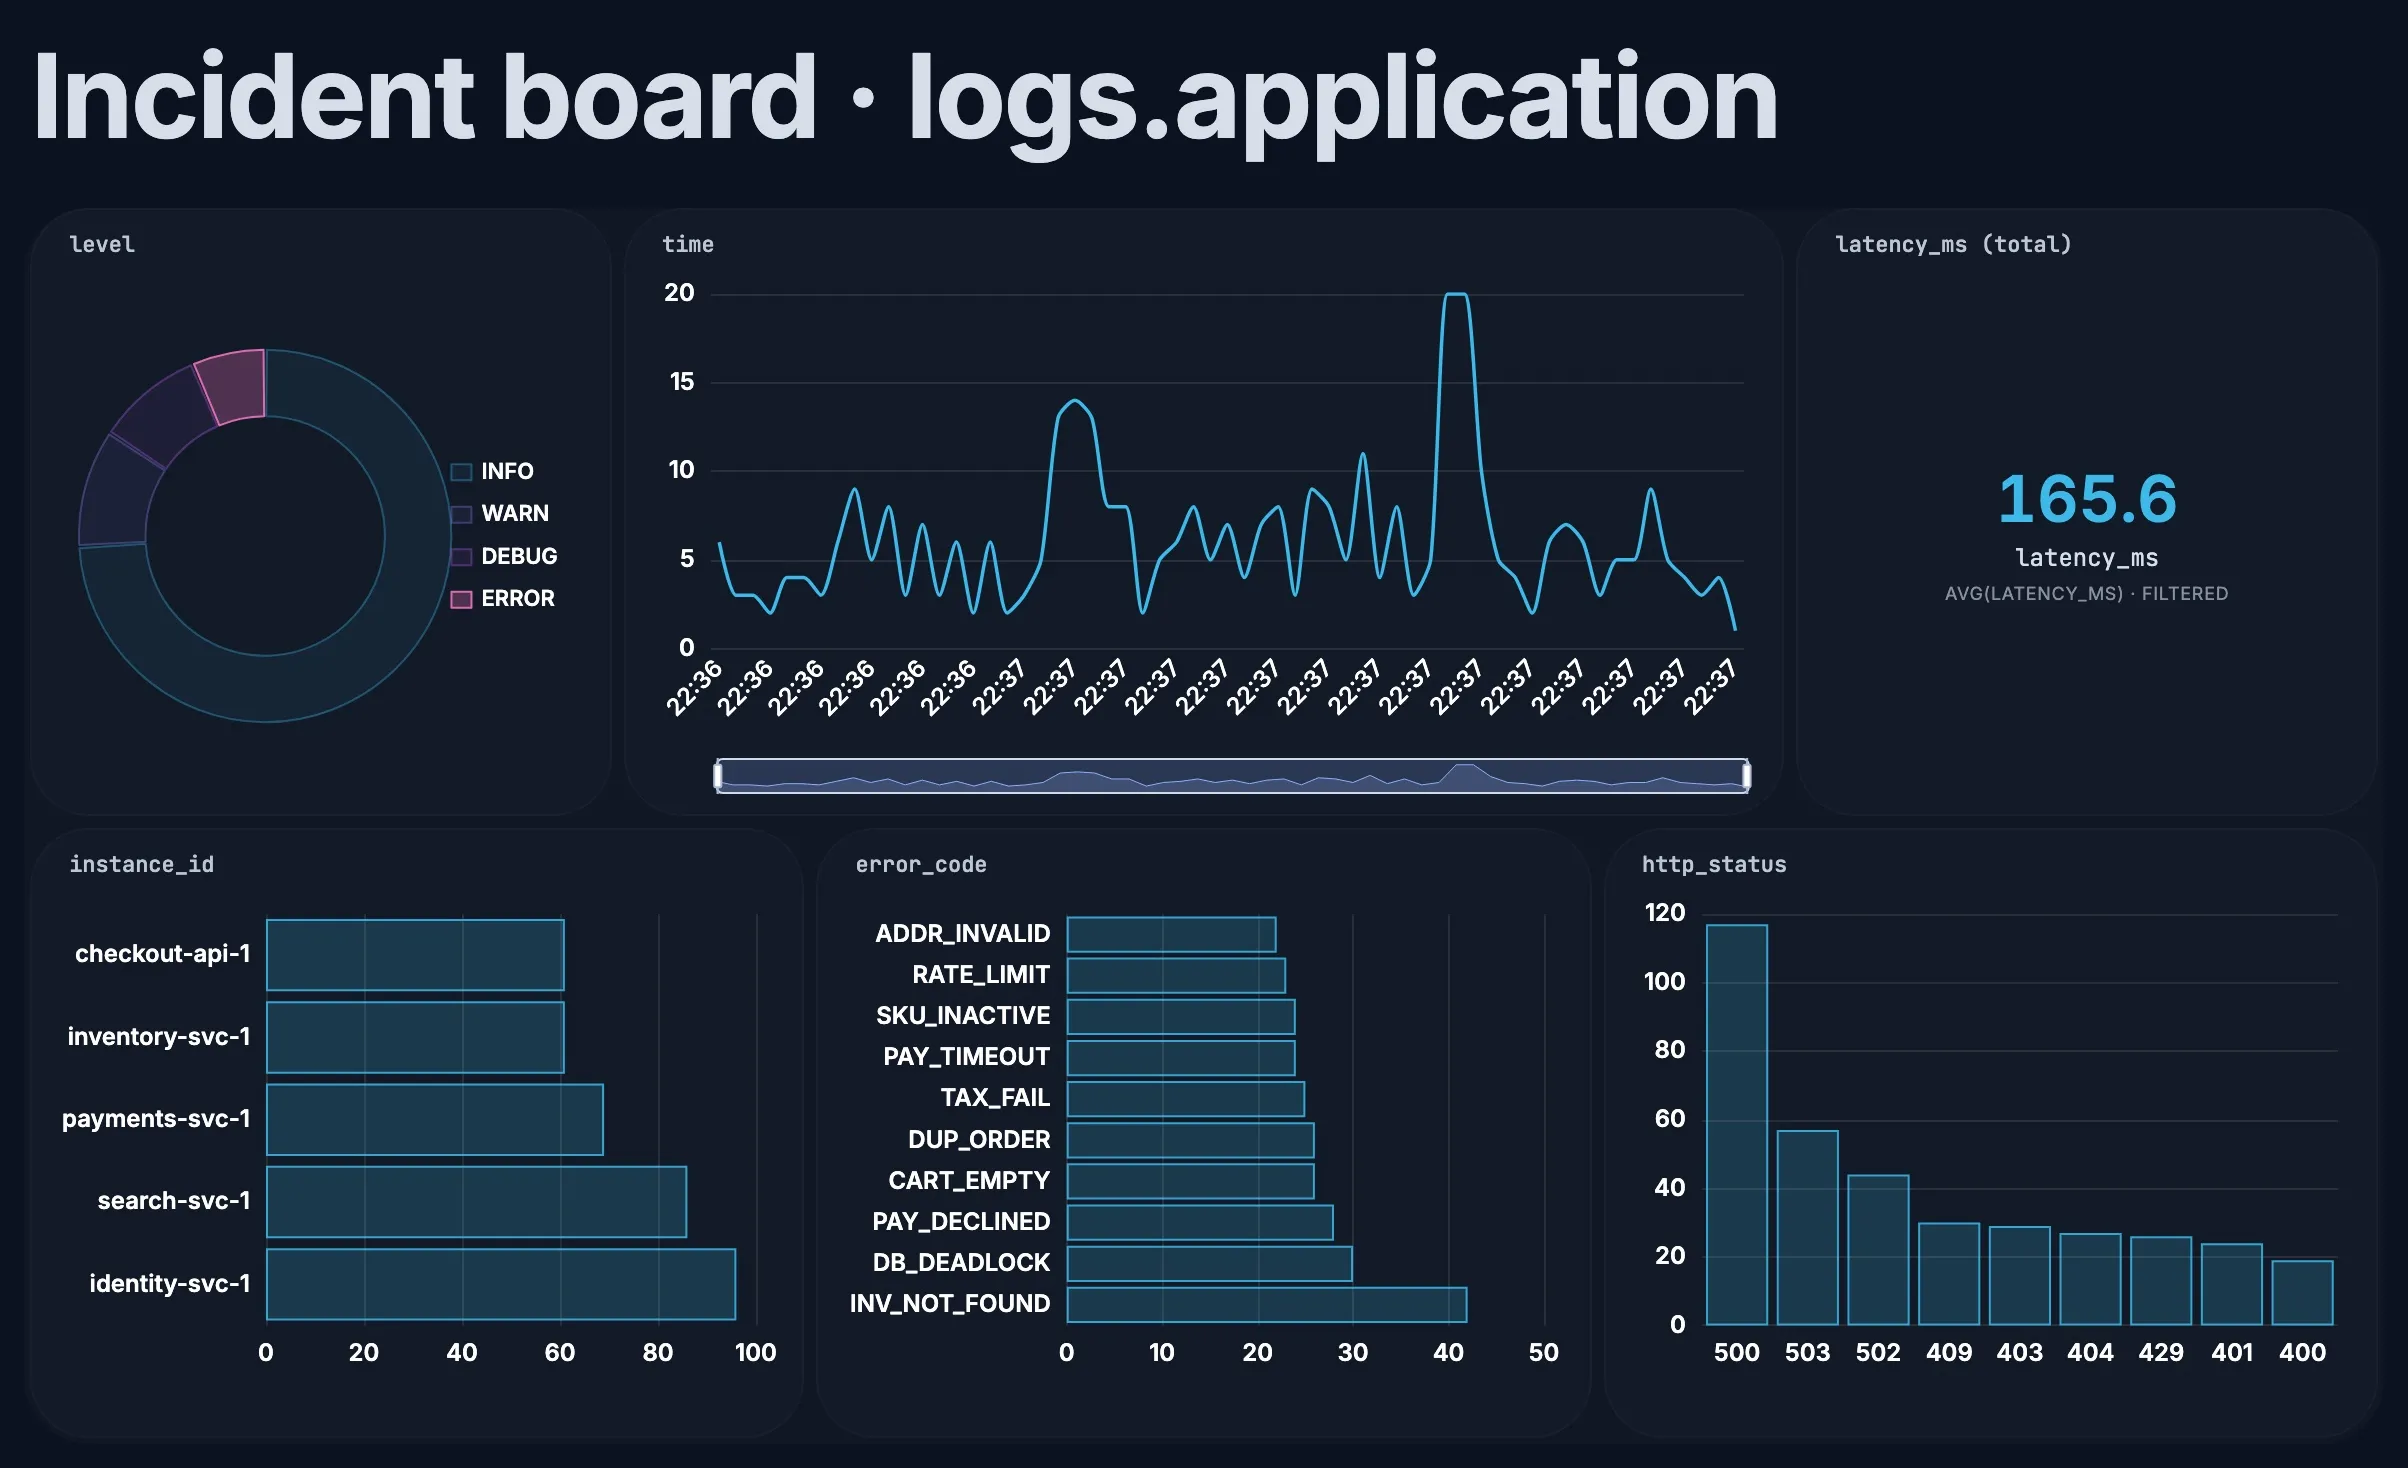
In the example, the line runs at three to eight errors a second, with two clear spikes that last about three seconds each: one to 14 a second, one to 20. Click an instance in the instance_id chart and the line keeps only that instance’s errors. identity-svc-1 owns the first spike and search-svc-1 the second; each is flat apart from its own burst. One instance at a time, a different one each time, points at the instances themselves rather than a shared dependency.
A time chart buckets by the second for a window of a few minutes, and by the minute for longer ones. To change it, open the chart’s ⋯ menu and set the time bucket.
See how slow errors are
Section titled “See how slow errors are”Click ERROR again to clear the filter, then drag latency_ms onto the canvas and choose Histogram in its ⋯ menu. Most requests finish in under 100 ms, with a long thin tail.
Click ERROR once more, and the histogram shifts right: errors took about 140 ms at the median, against about 30 ms for everything else, and every request slower than 300 ms, the ones the slow_requests trap caught, was an error. Slow requests and errors are the same problem here, not two.
Build an incident board
Section titled “Build an incident board”Lay the charts out as a board you can keep open while you work, or put on a screen for the team. Keep the level chart on it: with ERROR selected every card shows errors, and with it cleared every card shows all traffic.
| Card | How to make it |
|---|---|
| Levels | level, as a Donut. Click ERROR to filter the board |
| Over time | time from Envelope |
| By instance | instance_id, as a Horizontal bar |
| By code | error_code |
| Status codes | http_status. Burst errors return 500 |
| Average latency | latency_ms dropped on empty canvas for a KPI, with AVG as the metric |
Add a text block for a title, select the charts and choose Group to put them in a container, then turn on Live so the board reloads every few seconds. Present shows it full screen. See Explore and charts.
4. Check log health with a playbook
Section titled “4. Check log health with a playbook”A playbook is a saved list of queries you run against each new Load. In Explore, choose Playbook, add a playbook, and add these queries with + SQL. Explore creates a view for each topic, such as v_logs_application, with a column for each field.
Error bursts: any instance with 15 or more errors in a 5-second window.
SELECT strftime(time_bucket(INTERVAL 5 SECOND, event_ts), '%H:%M:%S') AS window_start, instance_id, COUNT(*) AS errorsFROM v_logs_applicationWHERE level = 'ERROR'GROUP BY ALLHAVING COUNT(*) >= 15ORDER BY errors DESCUnexpected audit sources: security events from services other than identity and payments.
SELECT service, COUNT(*) AS eventsFROM v_logs_auditWHERE service NOT IN ('identity-svc', 'payments-svc')GROUP BY 1Slowest routes: the five routes with the highest 95th-percentile latency.
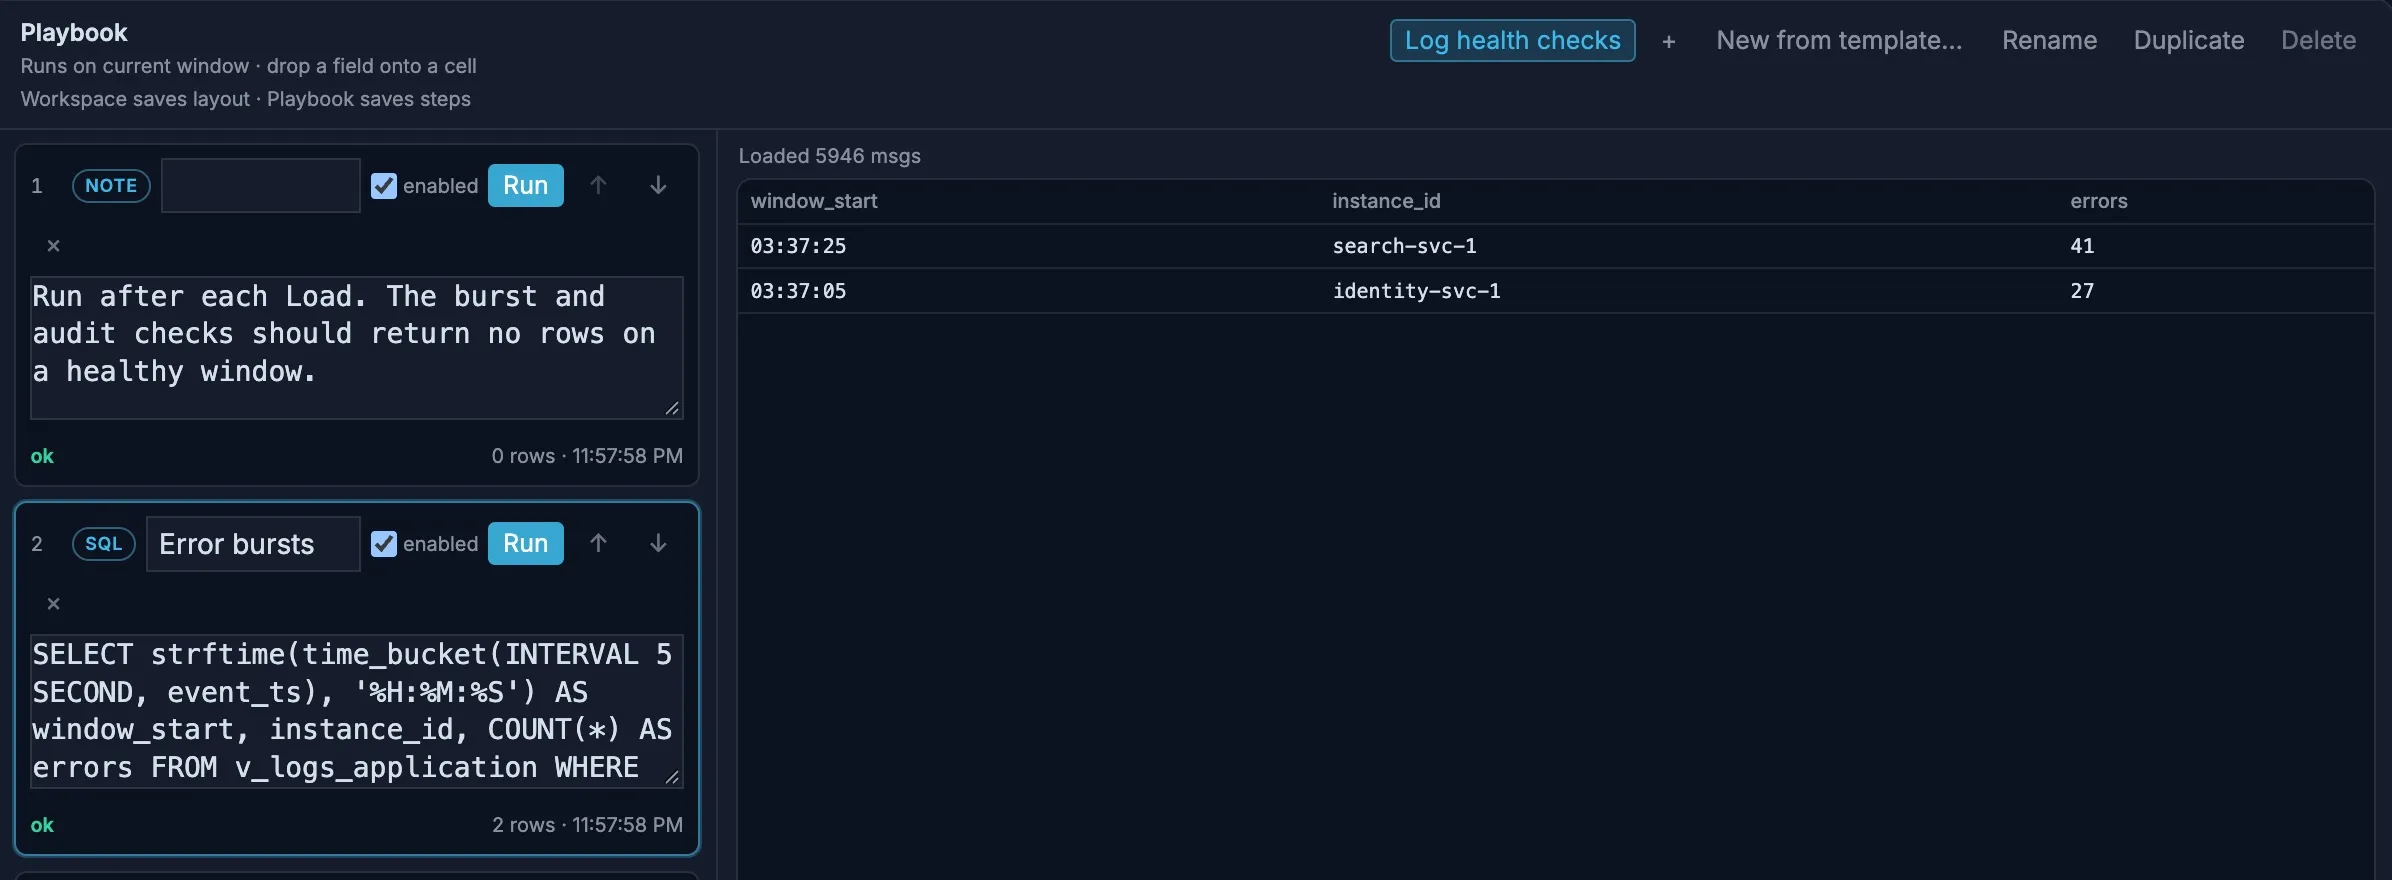
SELECT service, http_route, COUNT(*) AS requests, round(quantile_cont(latency_ms, 0.95)) AS p95_msFROM v_logs_applicationGROUP BY ALLORDER BY p95_ms DESCLIMIT 5Choose Run all. On a healthy window, the first two return no rows. In the example, the burst check found both bursts and named the instance behind each: 41 errors from search-svc-1 in 5 seconds, and 27 from identity-svc-1, against a normal 5 to 10.
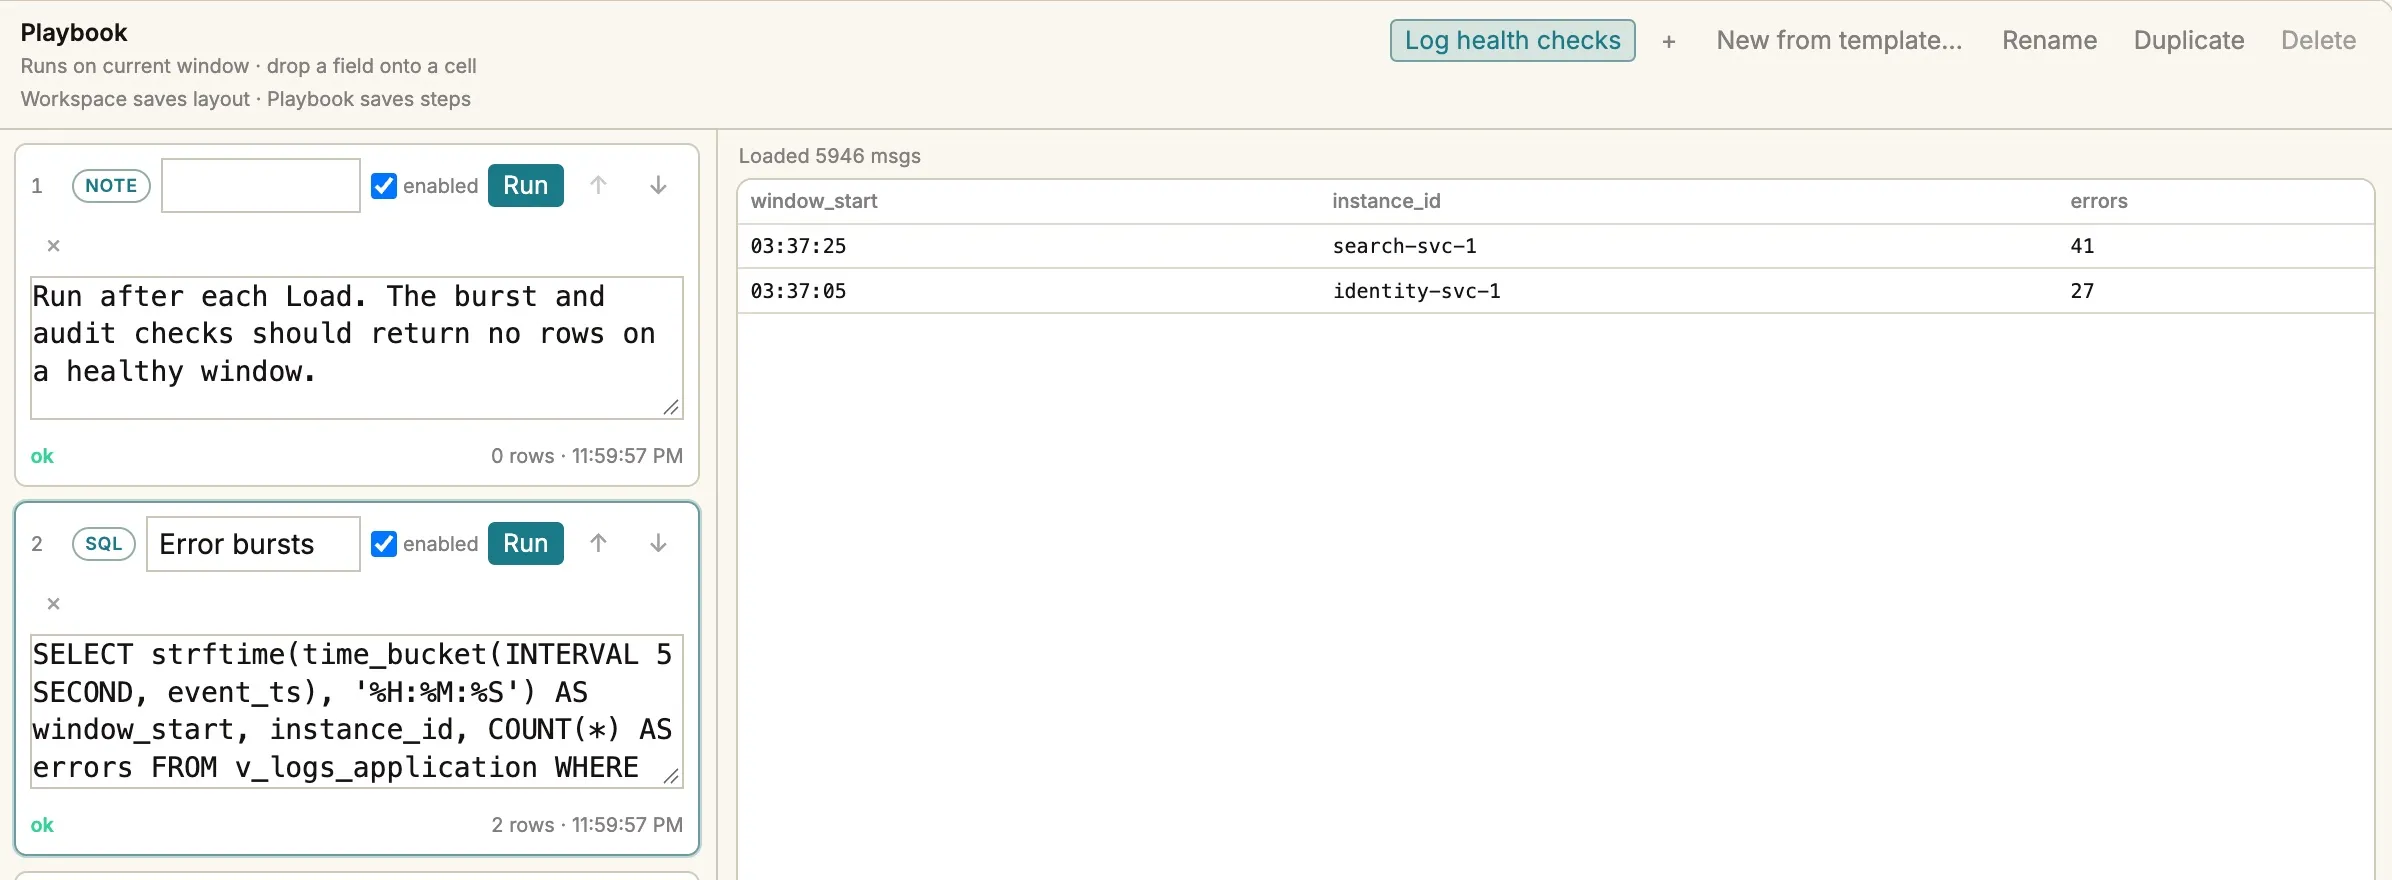
Adjust the window and threshold to your own traffic: check the normal rate first by removing the HAVING line.
Keep personal data out of view
Section titled “Keep personal data out of view”Log lines often carry user IDs, and audit events carry the user’s IP address. Add a PII redaction profile to logs.application and logs.audit to replace user_id, actor and ip with tokens before anyone sees them. The tokens are consistent, so you can still count errors per user or follow one user’s requests.
Next steps
Section titled “Next steps”- Follow one request: copy a
trace_idfrom an error and add a trap onkey == "…"to collect every line for that request. - Watch a fixed incident window: start a source at a Timestamp with a Stop time. See Choose where to start reading.