

Tutorial: inspect a live shop
The Quickstart plays a file. This tutorial uses a real Kafka broker on your machine, fed by a small script that acts like an online shop. You’ll connect Akema to it as you would to any cluster, then use traps, Explore and SQL to find what’s going wrong in the shop. It takes about 30 minutes, and you remove everything at the end.
You need:
- Akema, running and open in your browser. See Install Akema. Keep the Akema tab open from here to the end.
- Docker, to run Kafka.
- bash, to run the shop script. macOS and Linux have it; on Windows, use WSL.
If Akema itself runs in Docker, start Kafka as shown in Akema in Docker instead of step 1.
1. Start Kafka
Section titled “1. Start Kafka”Start a single Kafka broker, the official Apache Kafka image, listening on localhost:9092:
docker run -d --name akema-kafka -p 9092:9092 apache/kafka:3.9.0Give it about 10 seconds to start, then create the shop’s two topics, with three partitions each:
for t in shop-orders shop-payments; do docker exec akema-kafka /opt/kafka/bin/kafka-topics.sh \ --bootstrap-server localhost:9092 --create --topic "$t" --partitions 3doneEach prints Created topic. Create the topics before you start the shop: this broker creates a missing topic on its own, but with only one partition.
2. Start the shop
Section titled “2. Start the shop”Download akema-shop.sh (4 KB) and run it:
bash akema-shop.shIt writes about four orders a second, and a payment for each, through the console producer inside the Kafka container, so it needs nothing else installed. Leave it running in its own terminal. It prints a line every 100 orders, and Ctrl-C stops it.
| Topic | Key | Holds |
|---|---|---|
shop-orders |
order_id |
Each order: customer, email, country, items and total_usd |
shop-payments |
order_id |
The payment for each order: method, amount_usd, and a status of captured or declined |
Every message also has a source header saying where it came from: web, mobile or payments. An order looks like this:
{ "order_id": "ORD-100261", "customer_id": "C00409", "email": "c00409@example.com", "country": "CA", "items": 3, "total_usd": 208.59}Like a real shop, this one has a few problems. You’ll find them in the steps below.
3. Connect Akema
Section titled “3. Connect Akema”- Open the Connect tab and choose Add Source.
- Set Name to
Local shop. Bootstrap is alreadylocalhost:9092. - Open Topic(s), choose Load topics, and click
shop-ordersandshop-payments. Choose Done. - Leave Start mode at Earliest, so Akema reads from the first order.
- Choose Test, then Start.
The column changes to Live, and a Local shop pill appears in the stream bar with a count that keeps climbing. See Connect to Kafka for every setting.
4. Look at the messages
Section titled “4. Look at the messages”Open Inspect. Orders and payments arrive in the live table, each with its topic, partition, offset and key. Select a row to open it in the Record pane: the key, the value as a tree of fields, and the source header.
To follow one order, type its ID, such as ORD-100300, in the Filter box above the table. Two rows remain: the order and its payment. They’re on the same partition number, because both topics have three partitions and Kafka chooses the partition from the key. Every message for one order lands in one partition, in order. Choose Clear to see everything again.
5. Trap what matters
Section titled “5. Trap what matters”Traps check every new message as it arrives, and tag and count the ones that match. Add three.
Declined payments, from a field. Select a shop-payments row and, in the Record pane, choose Trap next to status. Change Value from captured to declined and choose Create trap. The trap is named after the field; choose the pencil on its card, change the name to declined, and choose Update trap.
Big orders, in CEL. Choose + New, then Advanced CEL. Name it big_order, enter this expression, and choose Save trap:
topic == "shop-orders" && value_json.total_usd > 1000Messages without a key. Add one more the same way, named no_key:
key == "(null)"Akema shows a missing key as (null). A message without a key goes to whichever partition the producer picks, so it can arrive out of order with the rest of its order. In this shop, they come from a load-test client that was left running.
Now watch the counters. big_order and no_key tick up now and then. About two minutes after you started the shop, declined starts climbing much faster than before. Something has gone wrong with payments.
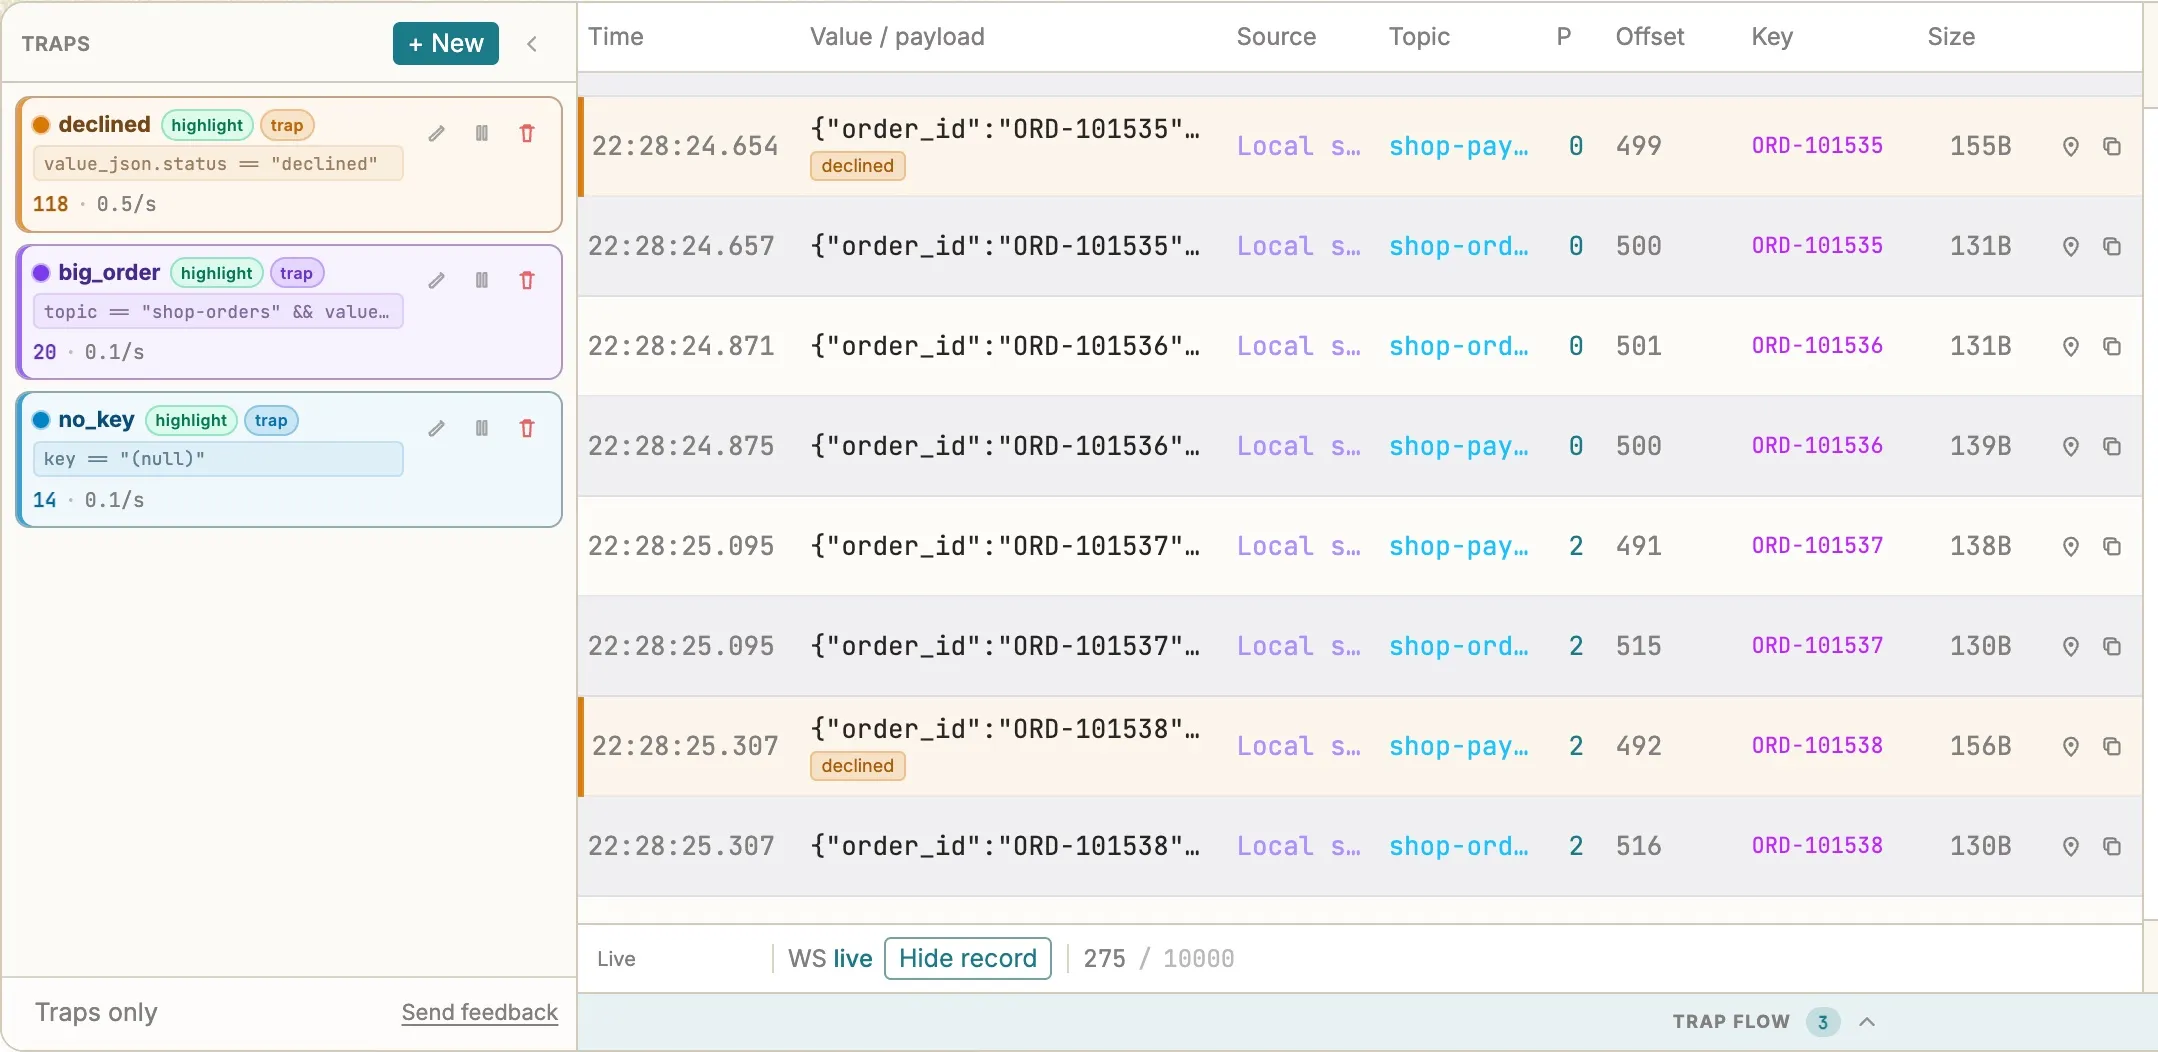
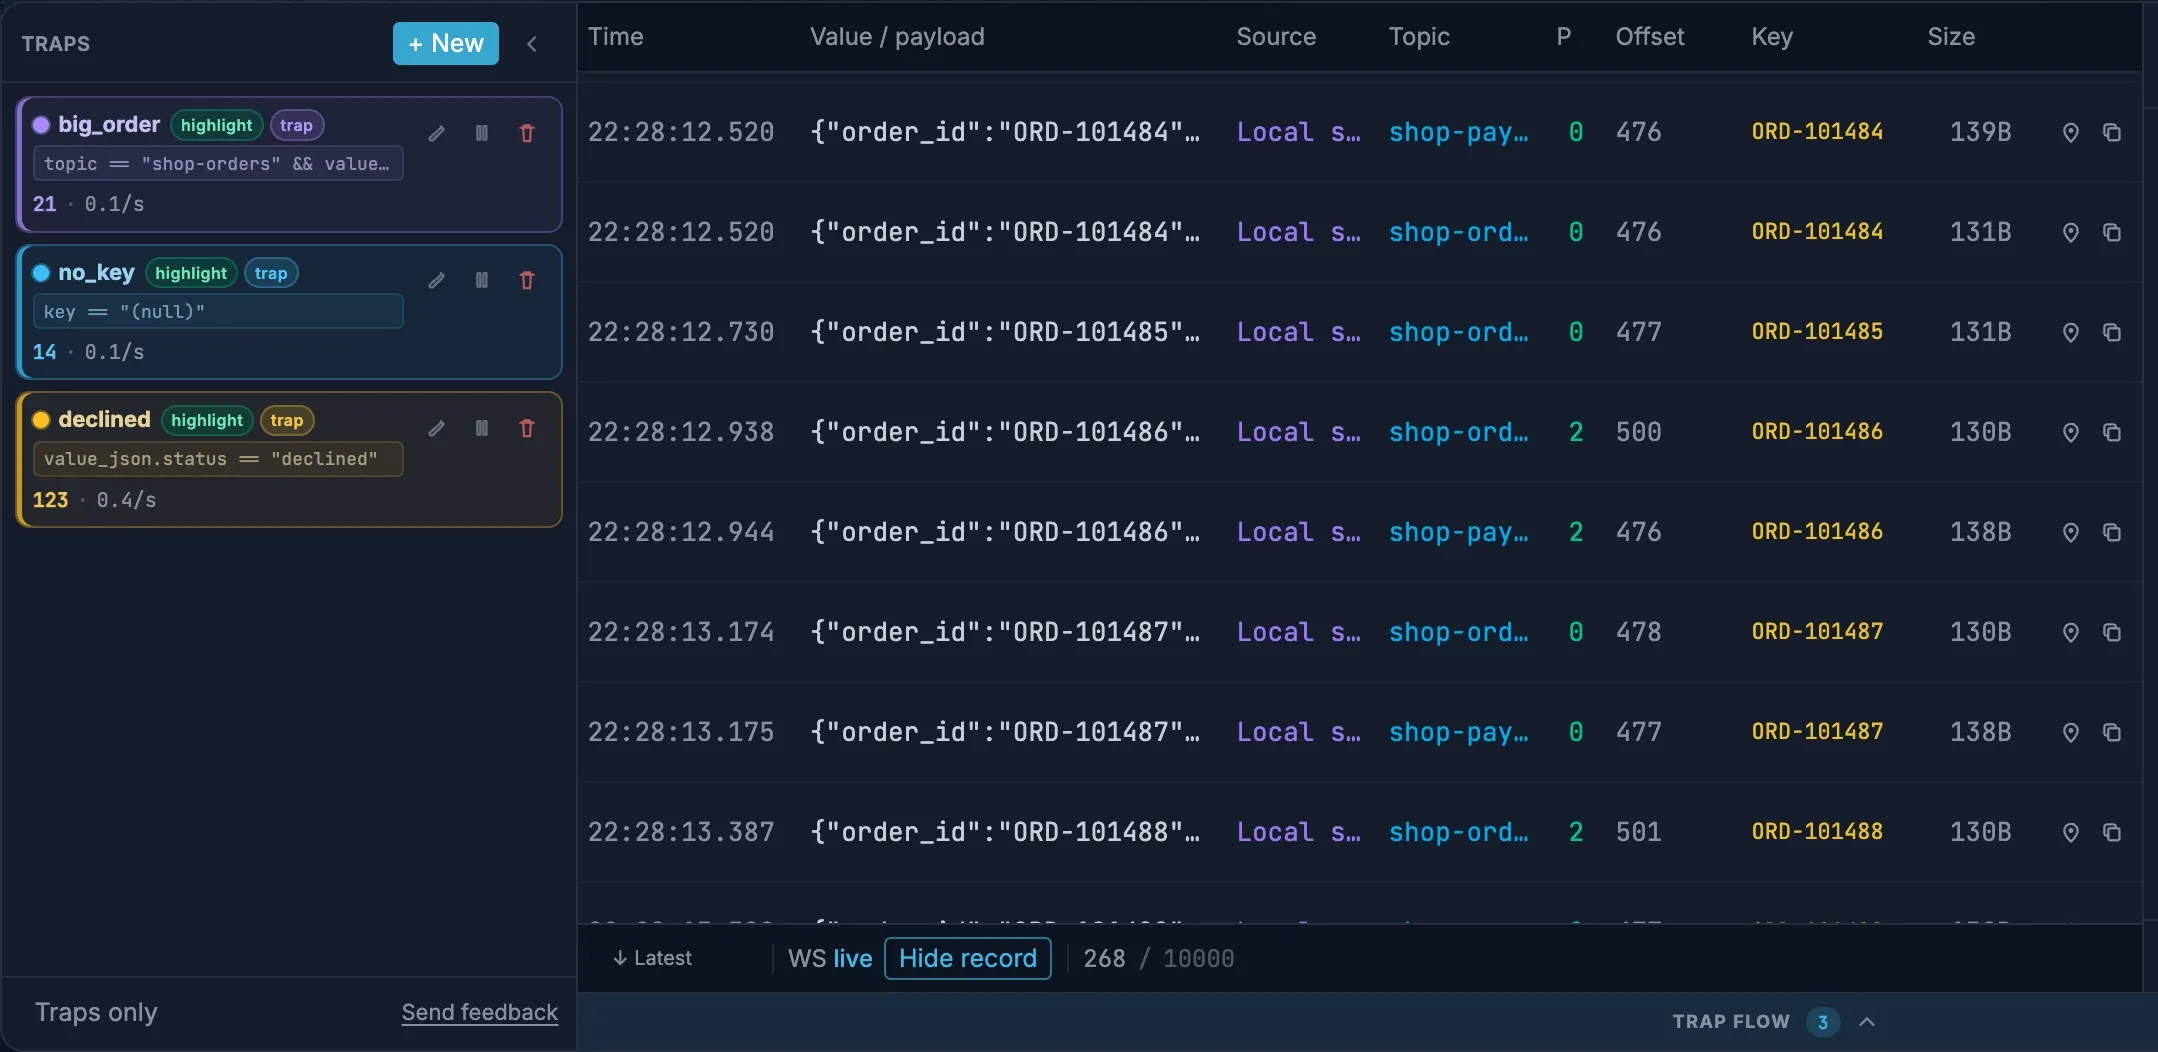
Select a tagged declined row to see why it was declined: decline_reason. The Trap Flow chart under the table shows the declines as a share of the stream.
6. Find the cause in Explore
Section titled “6. Find the cause in Explore”Let the shop run for a few minutes, so the window holds payments from before and after the problem started. Then open Explore and choose Load.
- Drag
statusfromshop-paymentsonto the canvas. Most payments arecaptured. - Drag
methodfromshop-paymentsnext to it. - In the
statuschart, clickdeclined.
The method chart now shows only declined payments, and PayPal stands far above card and Apple Pay, though fewer than a third of payments use PayPal. Drag decline_reason next to it: PayPal’s declines are provider_timeout, not the customer’s card or balance. The payment provider is failing, not the shoppers.
Click declined again to clear the filter. See Explore and charts for the rest.
7. Check every order with SQL
Section titled “7. Check every order with SQL”Charts show what’s there. To find what’s missing, use SQL. Explore creates a view for each topic, v_shop_orders and v_shop_payments, with each field as a column.
In Explore, choose Playbook, add a playbook named Payment checks, and add these queries with + SQL.
Declines by method: the share of each method’s payments that were declined.
SELECT method, COUNT(*) AS payments, COUNT(*) FILTER (WHERE status = 'declined') AS declined, round(100.0 * COUNT(*) FILTER (WHERE status = 'declined') / COUNT(*), 1) AS declined_pctFROM v_shop_paymentsGROUP BY 1ORDER BY declined_pct DESCPayPal by minute: when the problem started. Times are in UTC.
SELECT strftime(date_trunc('minute', timestamp), '%H:%M') AS minute, COUNT(*) AS payments, COUNT(*) FILTER (WHERE status = 'declined') AS declinedFROM v_shop_paymentsWHERE method = 'paypal'GROUP BY 1ORDER BY 1Orders without a payment: every order should have one.
SELECT o.order_id, o.customer_id, o.total_usdFROM v_shop_orders oWHERE NOT EXISTS ( SELECT 1 FROM v_shop_payments p WHERE p.order_id = o.order_id)ORDER BY o.order_idWrong amounts: a payment should charge exactly the order’s total.
SELECT o.order_id, o.total_usd, p.amount_usdFROM v_shop_orders oJOIN v_shop_payments p USING (order_id)WHERE p.amount_usd <> o.total_usdChoose Run all, then click a cell to see its result.
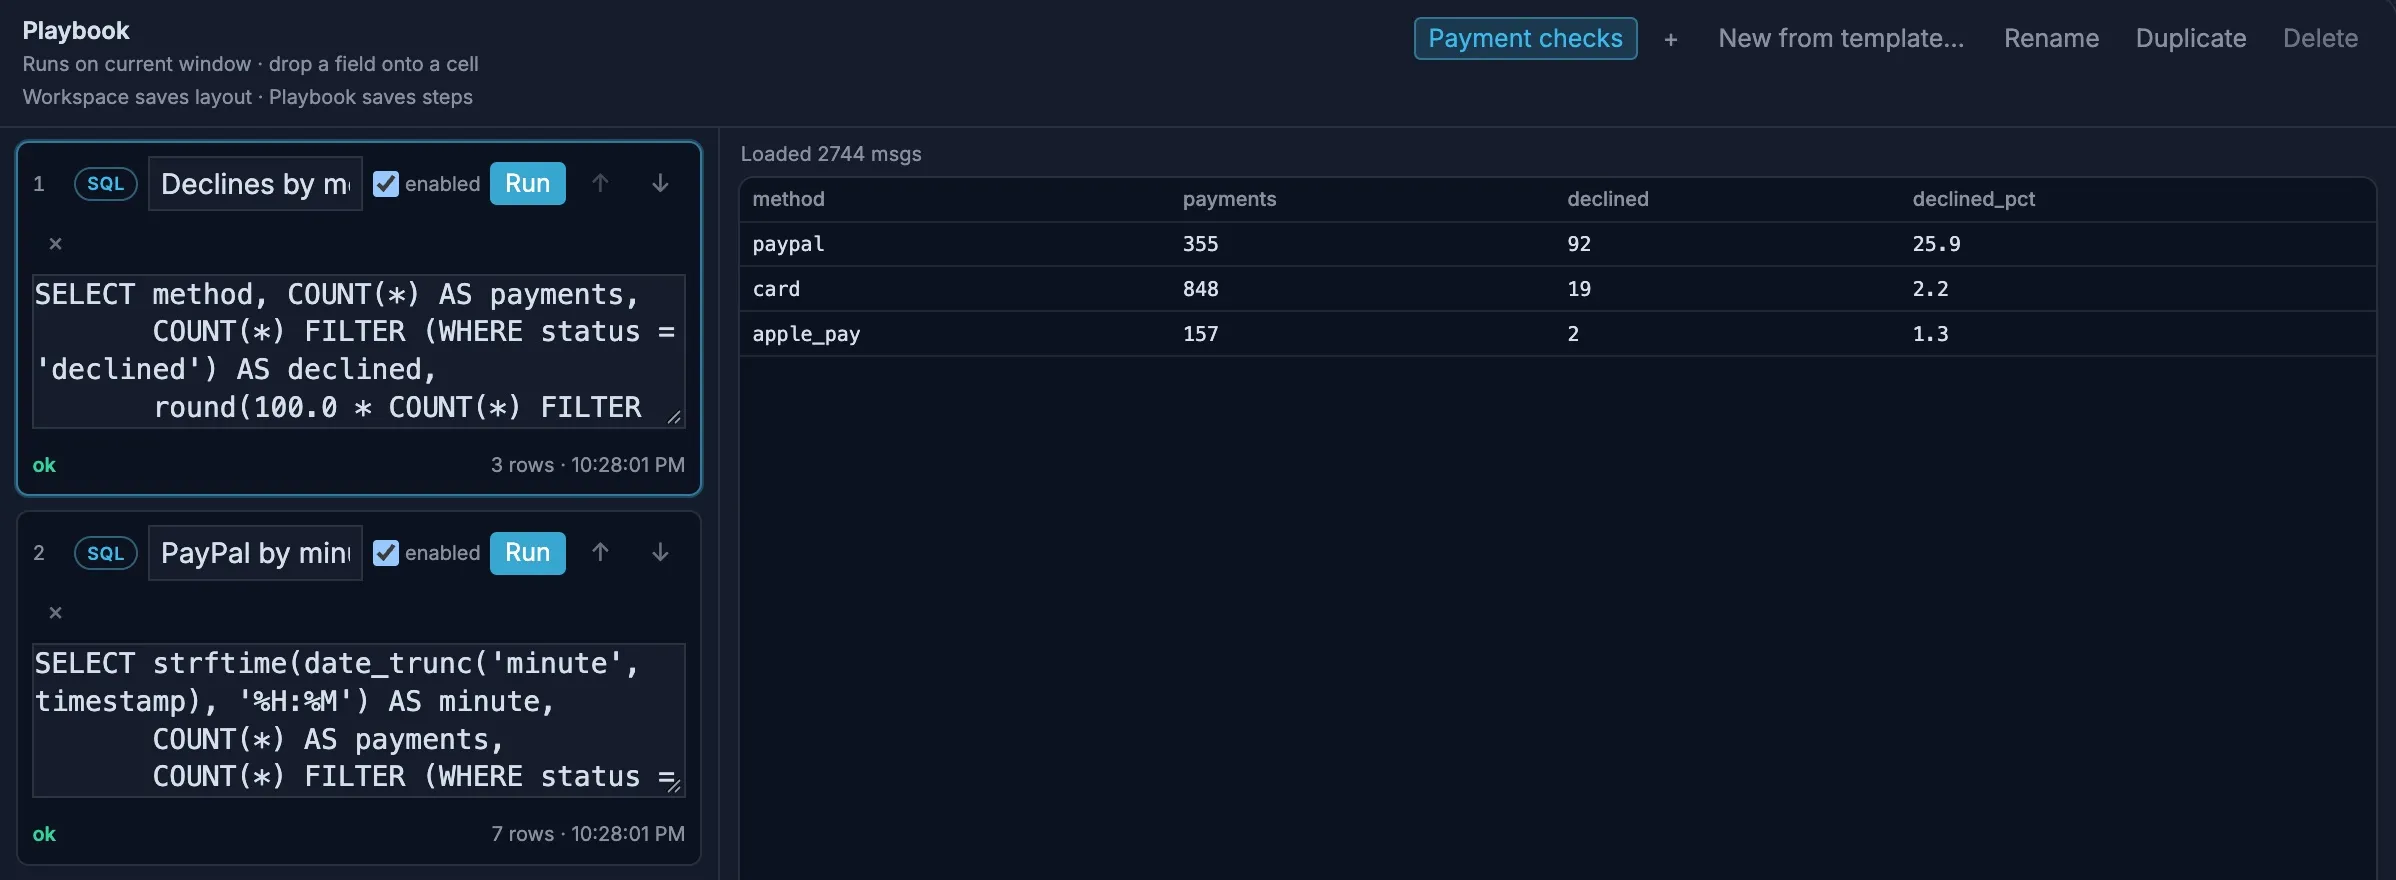
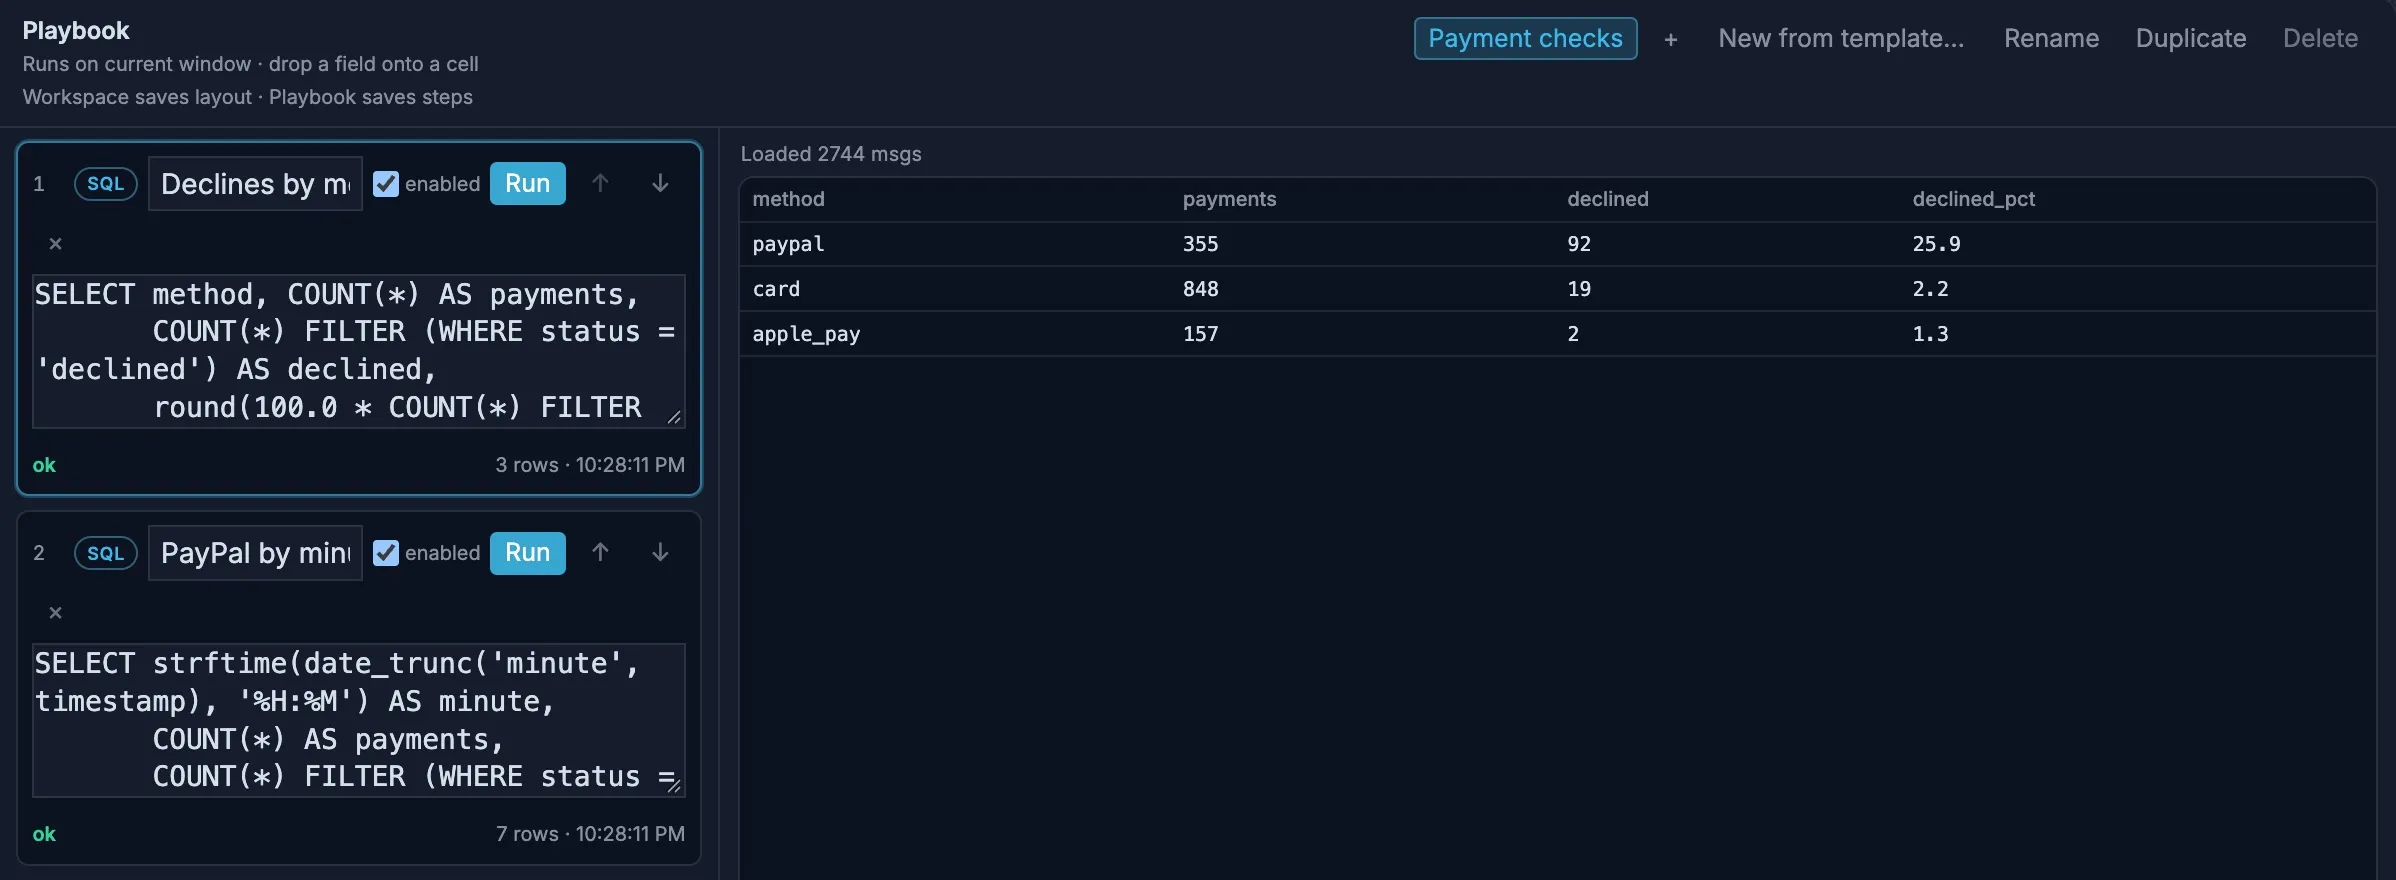
In a test run of about six minutes, 1,384 orders:
- Declines by method: 25.9% of PayPal payments were declined, against 2.2% for card and 1.3% for Apple Pay.
- PayPal by minute: PayPal had at most one decline a minute for the first two minutes, then 20 to 30 a minute from then on. That’s the minute to look for in the payment provider’s status page and your own deploy log.
- Orders without a payment: 24 orders, about 2%, never got a payment. Each is a customer who may have been charged nothing, or charged somewhere you can’t see.
- Wrong amounts: 13 payments charged more than the order’s total, each by exactly $10.00. A difference that’s always the same usually means a fee or rounding rule applied in the wrong place.
Your numbers will differ a little, since the shop is random, but the patterns will be the same.
Neither of the last two shows up in a trap or a chart: each message looks fine on its own. Only comparing the two topics finds them. Choose Reload and Run all again at any time to check the newest window.
8. Clean up
Section titled “8. Clean up”-
Stop the shop with Ctrl-C.
-
In Akema, choose × on the Local shop pill to remove the source. The traps and playbook stay in the workspace for next time.
-
Remove Kafka, and its data with it:
Terminal window docker rm -f akema-kafka
Akema in Docker
Section titled “Akema in Docker”If Akema runs in a container, it can’t reach localhost:9092 on your machine. Put Kafka and Akema on one Docker network instead, and have Kafka advertise its container name. Replace step 1 with:
docker network create akema-tutorialdocker run -d --name akema-kafka --network akema-tutorial \ -e KAFKA_NODE_ID=1 \ -e KAFKA_PROCESS_ROLES=broker,controller \ -e KAFKA_LISTENERS=PLAINTEXT://:9092,CONTROLLER://:9093 \ -e KAFKA_ADVERTISED_LISTENERS=PLAINTEXT://akema-kafka:9092 \ -e KAFKA_LISTENER_SECURITY_PROTOCOL_MAP=CONTROLLER:PLAINTEXT,PLAINTEXT:PLAINTEXT \ -e KAFKA_CONTROLLER_LISTENER_NAMES=CONTROLLER \ -e KAFKA_CONTROLLER_QUORUM_VOTERS=1@localhost:9093 \ -e KAFKA_OFFSETS_TOPIC_REPLICATION_FACTOR=1 \ apache/kafka:3.9.0docker network connect akema-tutorial YOUR_AKEMA_CONTAINERCreate the topics and run the shop exactly as above; they work inside the Kafka container. In step 3, set Bootstrap to akema-kafka:9092. To clean up, also run docker network disconnect akema-tutorial YOUR_AKEMA_CONTAINER and docker network rm akema-tutorial.
What’s next
Section titled “What’s next”- Hide the customers’ emails. Add a PII redaction profile to
shop-ordersthat givesemailthe Email shape technique, then re-read the source. - Point Akema at your own cluster. Connect to Kafka has the settings for Amazon MSK, Confluent Cloud and Azure Event Hubs.
- See more patterns. The use cases apply the same steps to logs, clickstreams, CDC, IoT and telecom data. The demo suite generates their traffic on a local Kafka like this one, so you can follow along.