

IoT and metrics
Kafka is a common way to move telemetry: servers report CPU and memory, services report request counts and latency, and machines on a factory floor report temperature and vibration many times a second. Dashboards, alerting and long-term storage all read from the same topics.
Those systems summarize and filter, so when an alert fires, or doesn’t, the question is often what the raw readings actually said. Akema reads the readings themselves, checks each one as it arrives, and lets you compare them with the alerts that were sent.
The example
Section titled “The example”A company streams two kinds of telemetry to Kafka:
| Topic | Key | Holds |
|---|---|---|
metrics.host |
host_id |
Server gauges and counters: CPU, memory, disk, network |
metrics.http |
host_id |
Request counts, errors and latency per service |
iot.sensors |
device_id |
Readings from 250 factory machines across 3 plants: temperature, vibration, pressure, energy |
iot.alerts |
device_id |
Alerts from the alerting service when a reading crosses a threshold |
Every reading is one message with a metric_name, a value and a unit:
{ "device_id": "dev-PLT-C-L03-0170", "plant_id": "PLT-C", "line_id": "L03", "metric_name": "iot.temp_c", "value": 31.8536, "unit": "celsius", "firmware_version": "fw-3.4.8"}The alerting service sends an alert when a temperature reaches 85 °C or vibration reaches 4.5 g: critical for machines it knows are unhealthy, warning for the rest. A handful of machines are failing and run hot most of the time; healthy machines cross a threshold now and then.
1. Connect
Section titled “1. Connect”On Connect, add a source for your cluster with the four topics. Telemetry topics are busy, so set Start mode to Latest (tail). If a topic is too busy to keep up with, set Sample every on the source, or use the high_volume preset in Settings. Traps then check the sample, not every reading.
2. Trap readings over the line
Section titled “2. Trap readings over the line”Trap the raw readings, not just the alerts, so you see a problem even if the alerting service misses it. Add these traps:
| Trap | Expression | Catches |
|---|---|---|
overheat |
topic == "iot.sensors" && value_json.metric_name == "iot.temp_c" && value_json.value >= 85.0 |
Machines at 85 °C or more |
high_vibration |
topic == "iot.sensors" && value_json.metric_name == "iot.vibration_g" && value_json.value >= 4.5 |
Vibration of 4.5 g or more, an early sign of mechanical wear |
critical_alert |
topic == "iot.alerts" && value_json.severity == "critical" |
Critical alerts from the alerting service |
cpu_saturated |
topic == "metrics.host" && value_json.metric_name == "cpu.usage" && value_json.value > 95.0 |
Servers with CPU over 95% |
In a minute of telemetry, about 6,000 readings, Akema caught 31 overheating readings, 25 high-vibration readings, 26 critical alerts and 7 saturated CPUs, each pinned at 99%.
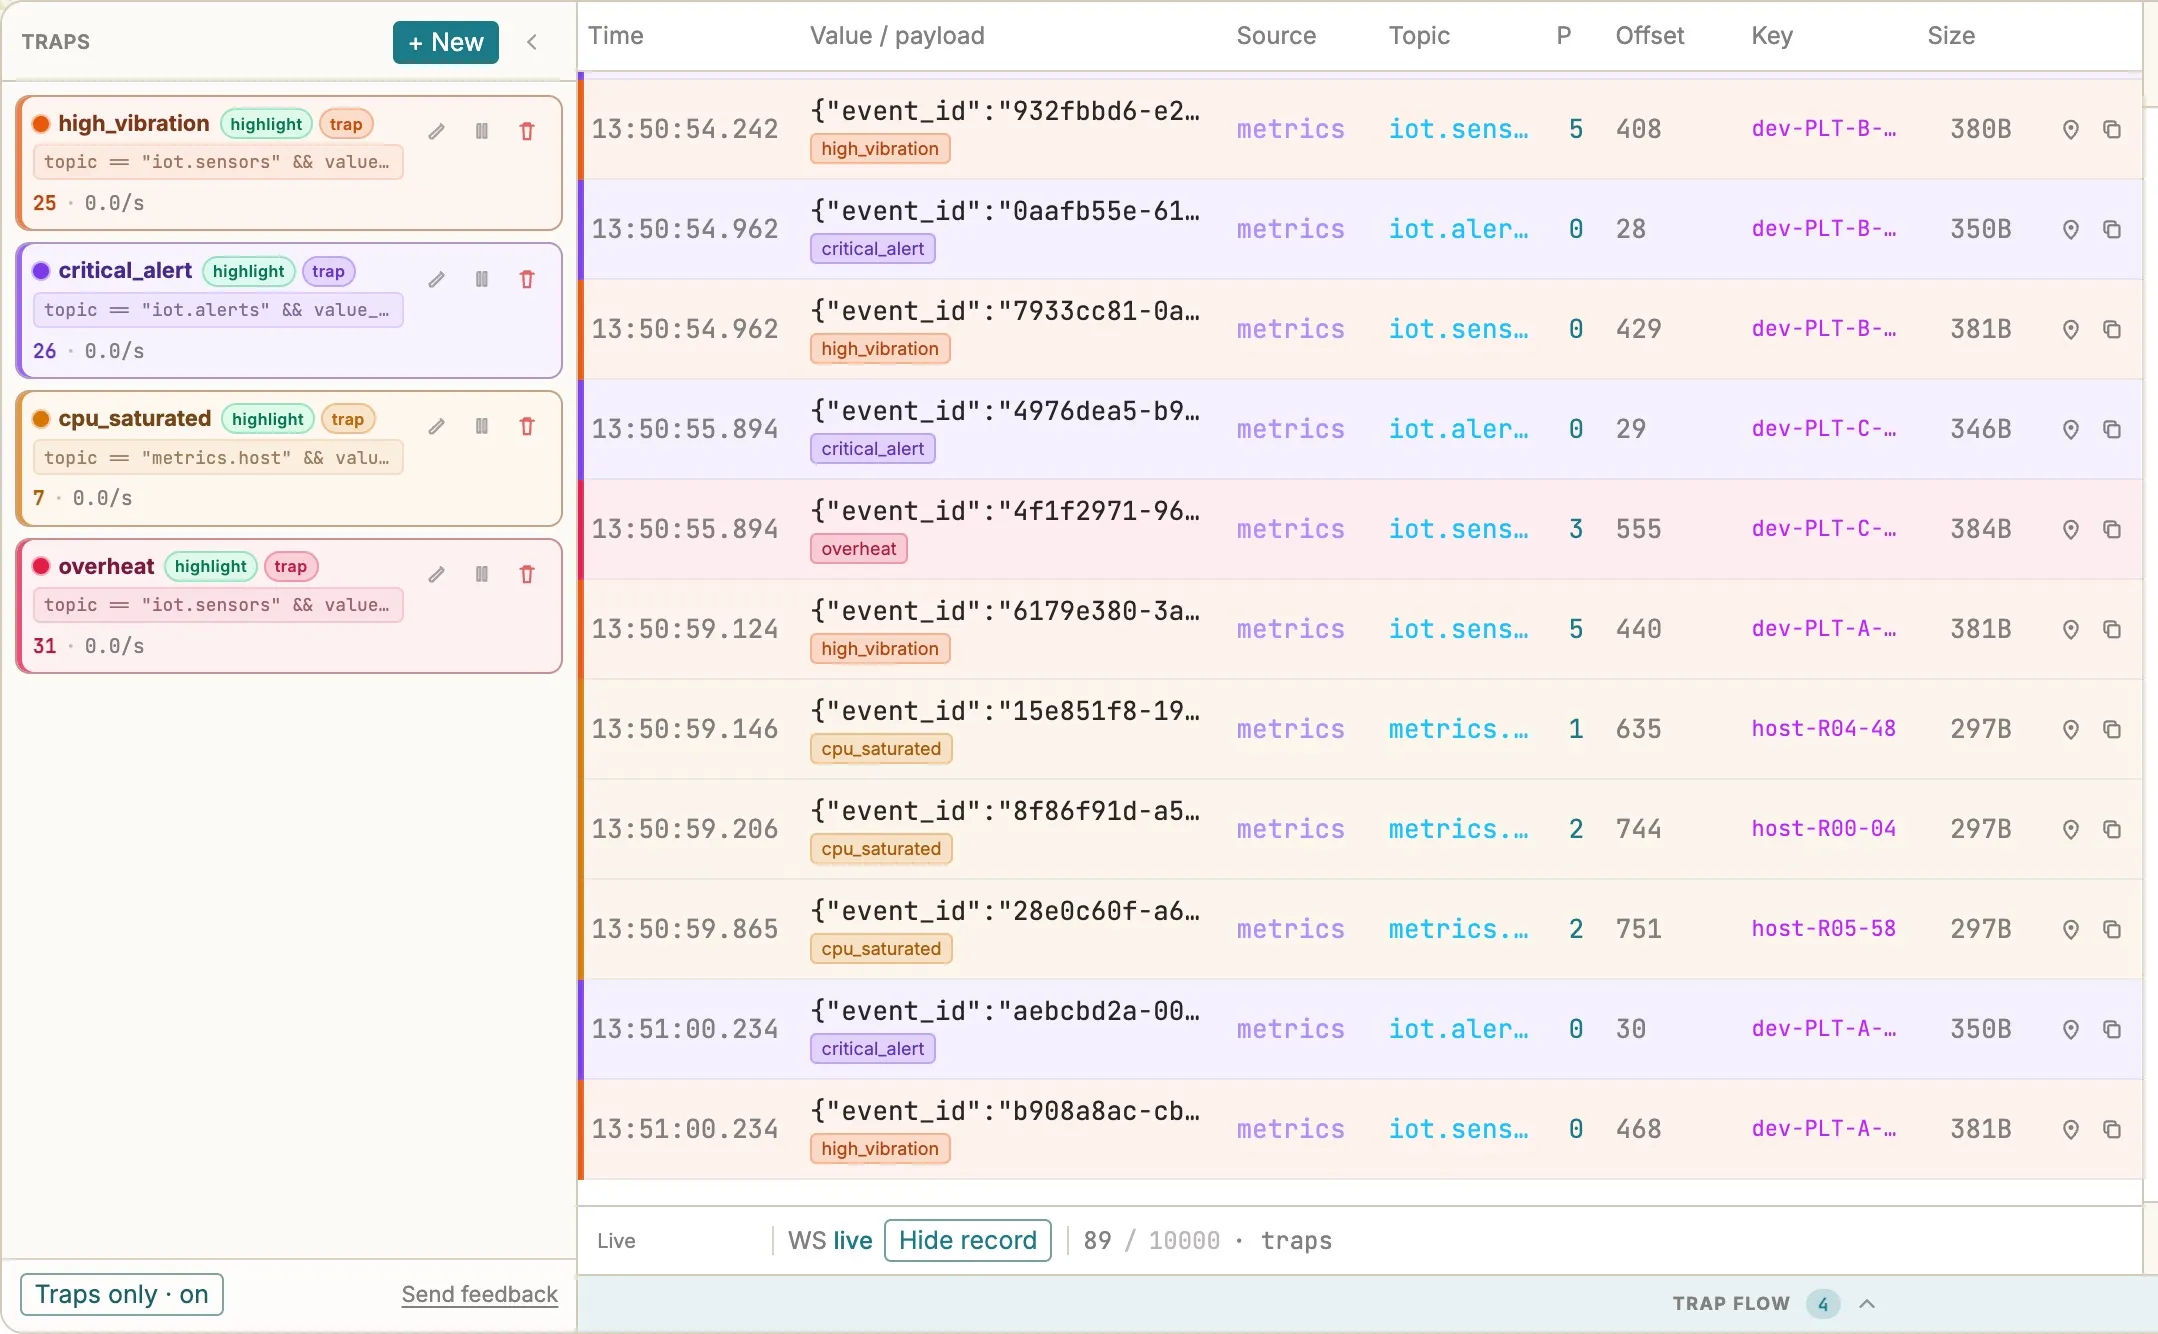
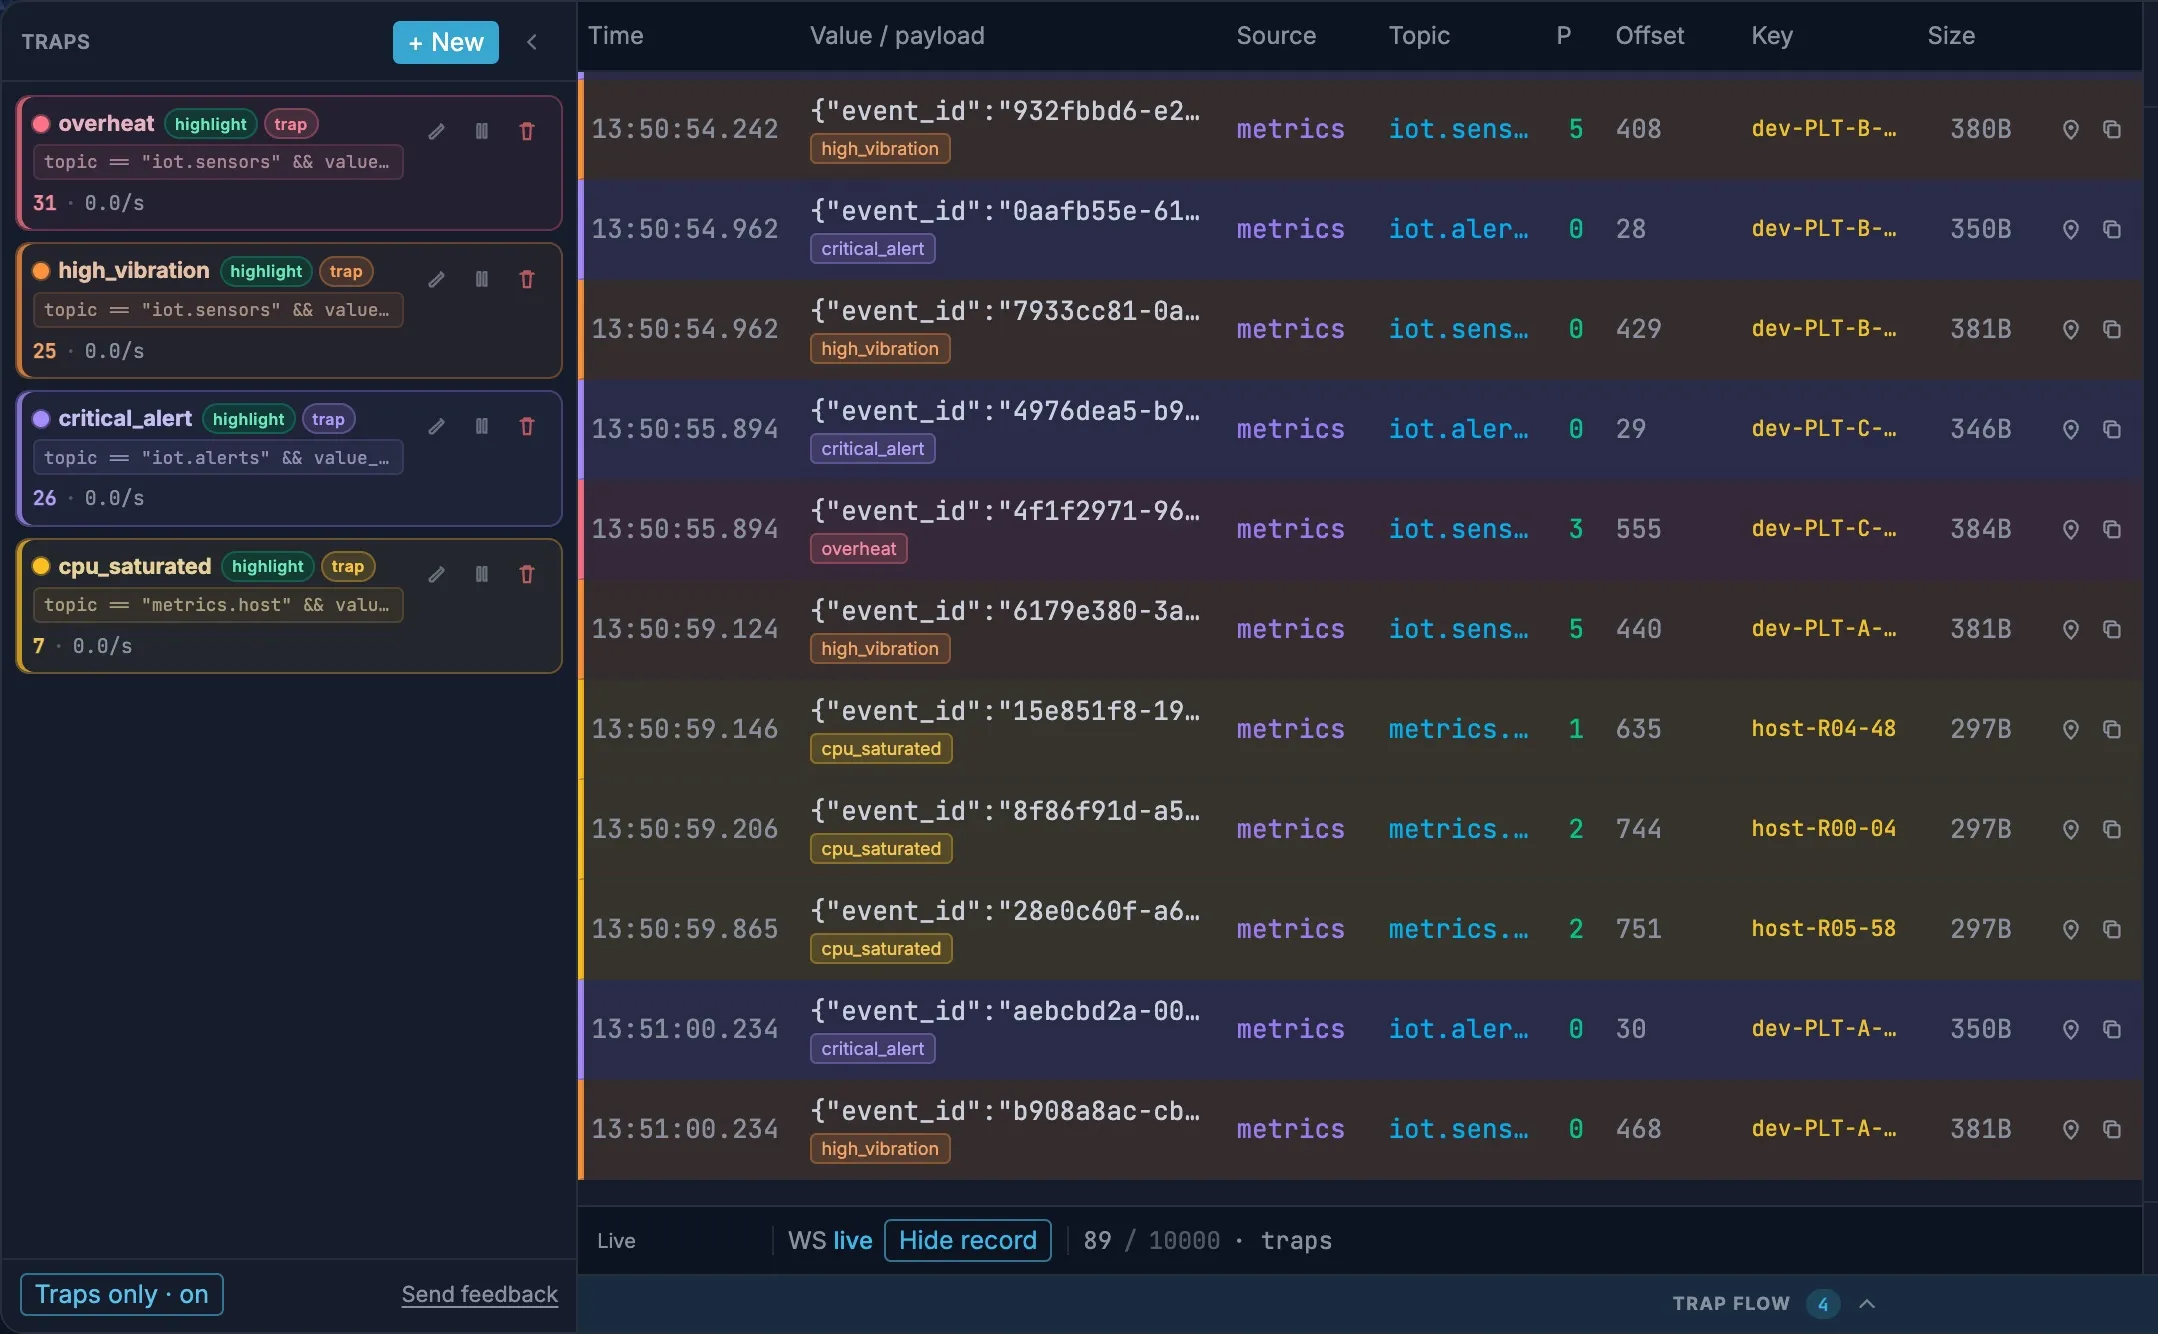
To watch one machine, copy its device_id and add a trap on key == "…". Every reading and alert for that machine is tagged as it arrives.
3. Find the machines behind the alerts
Section titled “3. Find the machines behind the alerts”Telemetry is easier to read as a picture than as rows: Explore shows where the alerts are on the factory floor, which machines run hot, and how far from normal they are. Choose Load to start.
Click through to the machines
Section titled “Click through to the machines”- Drag
device_idfromiot.alertsonto the canvas. A few machines stand far above the rest. - Drag
severityandmetric_namefromiot.alertsnext to it. Click a machine to see whether it’s overheating, vibrating or both. - To see the spread of temperatures, drag
metric_namefromiot.sensorsand clickiot.temp_c, then dragvaluefromiot.sensorsonto empty canvas and choose Histogram in its ⋯ menu. Most readings sit between about 18 and 42 °C; readings over 85 °C stand apart as a separate group.
Map the alerts onto the floor
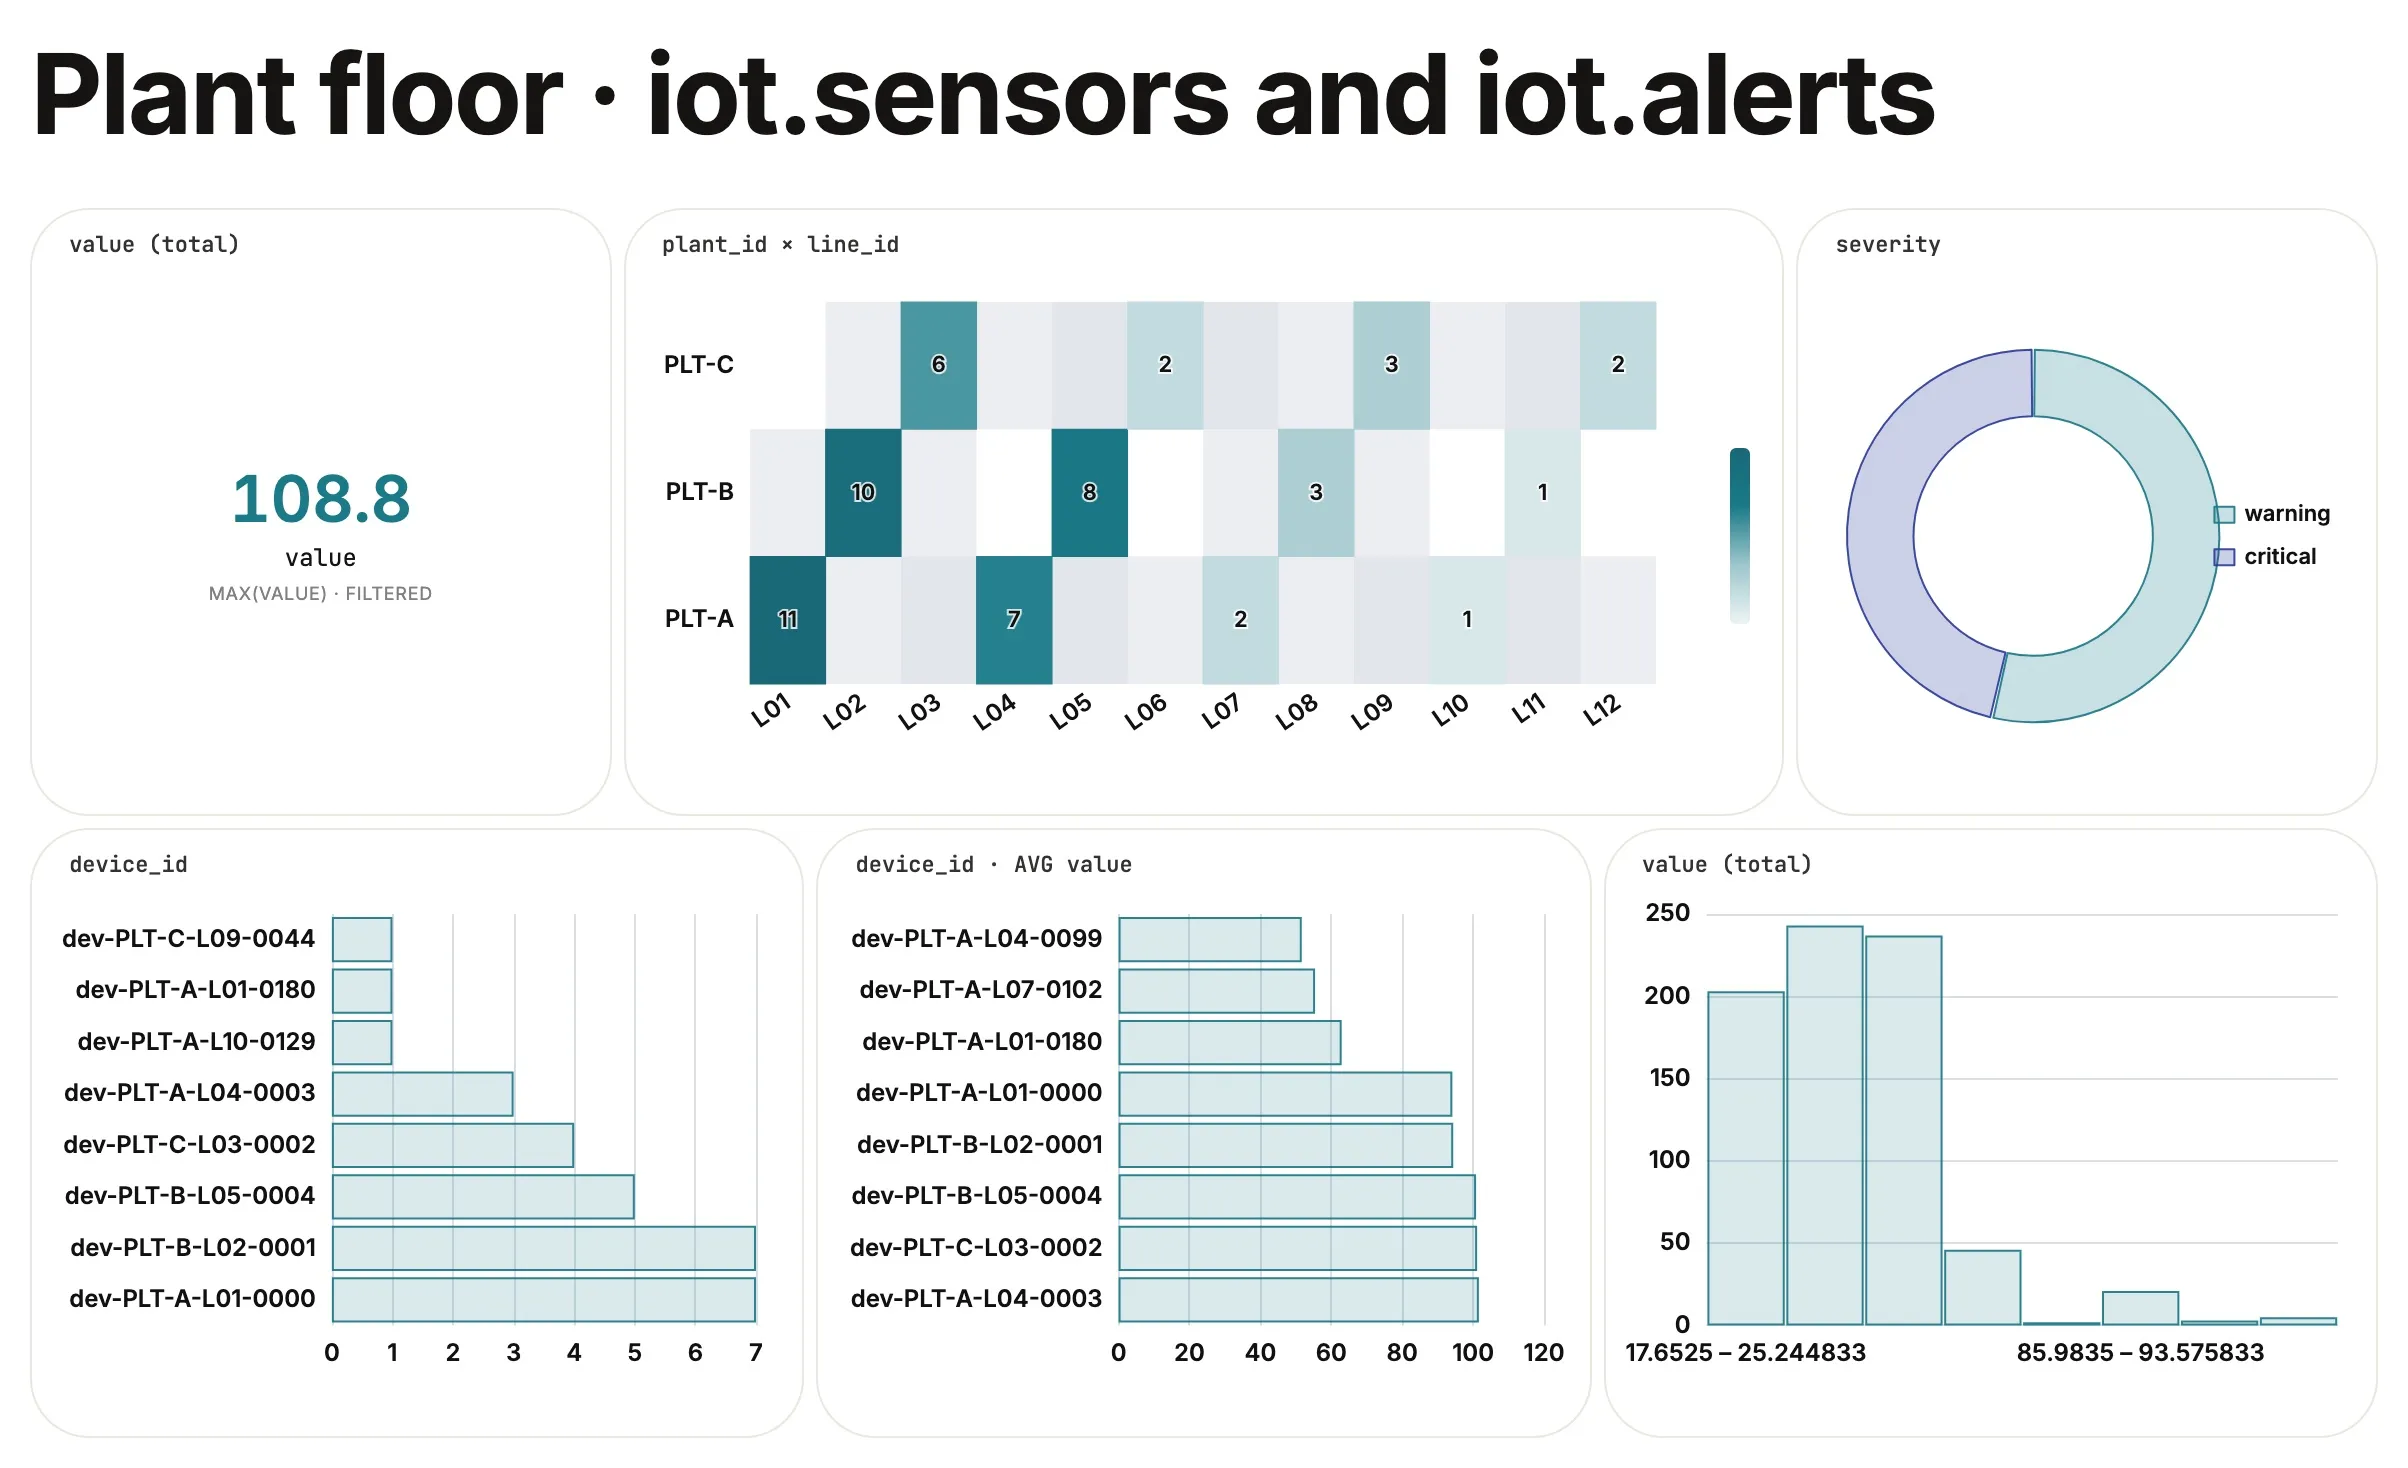
Section titled “Map the alerts onto the floor”Drag plant_id from iot.alerts onto the canvas, drop line_id from iot.alerts onto that chart, and choose Heatmap. Each cell is one production line in one plant, shaded by how many alerts it sent.
In the example, five cells stand out, with 6 to 11 alerts each, and they’re exactly the five lines with a failing machine. Every other line sent 3 warnings at most. On a real floor, a whole plant lighting up points at something shared, such as cooling or power; one hot cell points at one machine.
Rank the machines by temperature
Section titled “Rank the machines by temperature”With iot.temp_c still selected, drag device_id from iot.sensors onto the canvas, drop value onto it, and choose AVG. In the chart’s ⋯ menu, sort by value, highest first, and set Max rows to 10.
The five failing machines sit at the top, averaging well over 90 °C, far clear of the next machine. Because the chart reads the sensor readings, not the alerts, it would show a hot machine even if the alerting service had missed it.
The metric_name filter applies only to charts from iot.sensors, so the alert charts beside them keep counting every alert.
Build a plant-floor board
Section titled “Build a plant-floor board”| Card | How to make it |
|---|---|
| Metric | metric_name from iot.sensors. Click iot.temp_c so the sensor cards show temperature |
| Alerts by line | plant_id and line_id from iot.alerts, as a Heatmap |
| Noisiest machines | device_id from iot.alerts, as a Horizontal bar |
| Severity | severity from iot.alerts, as a Donut |
| Hottest machines | device_id from iot.sensors with AVG of value |
| Temperature spread | value from iot.sensors as a Histogram |
| Peak temperature | value from iot.sensors dropped on empty canvas for a KPI, with MAX as the metric |
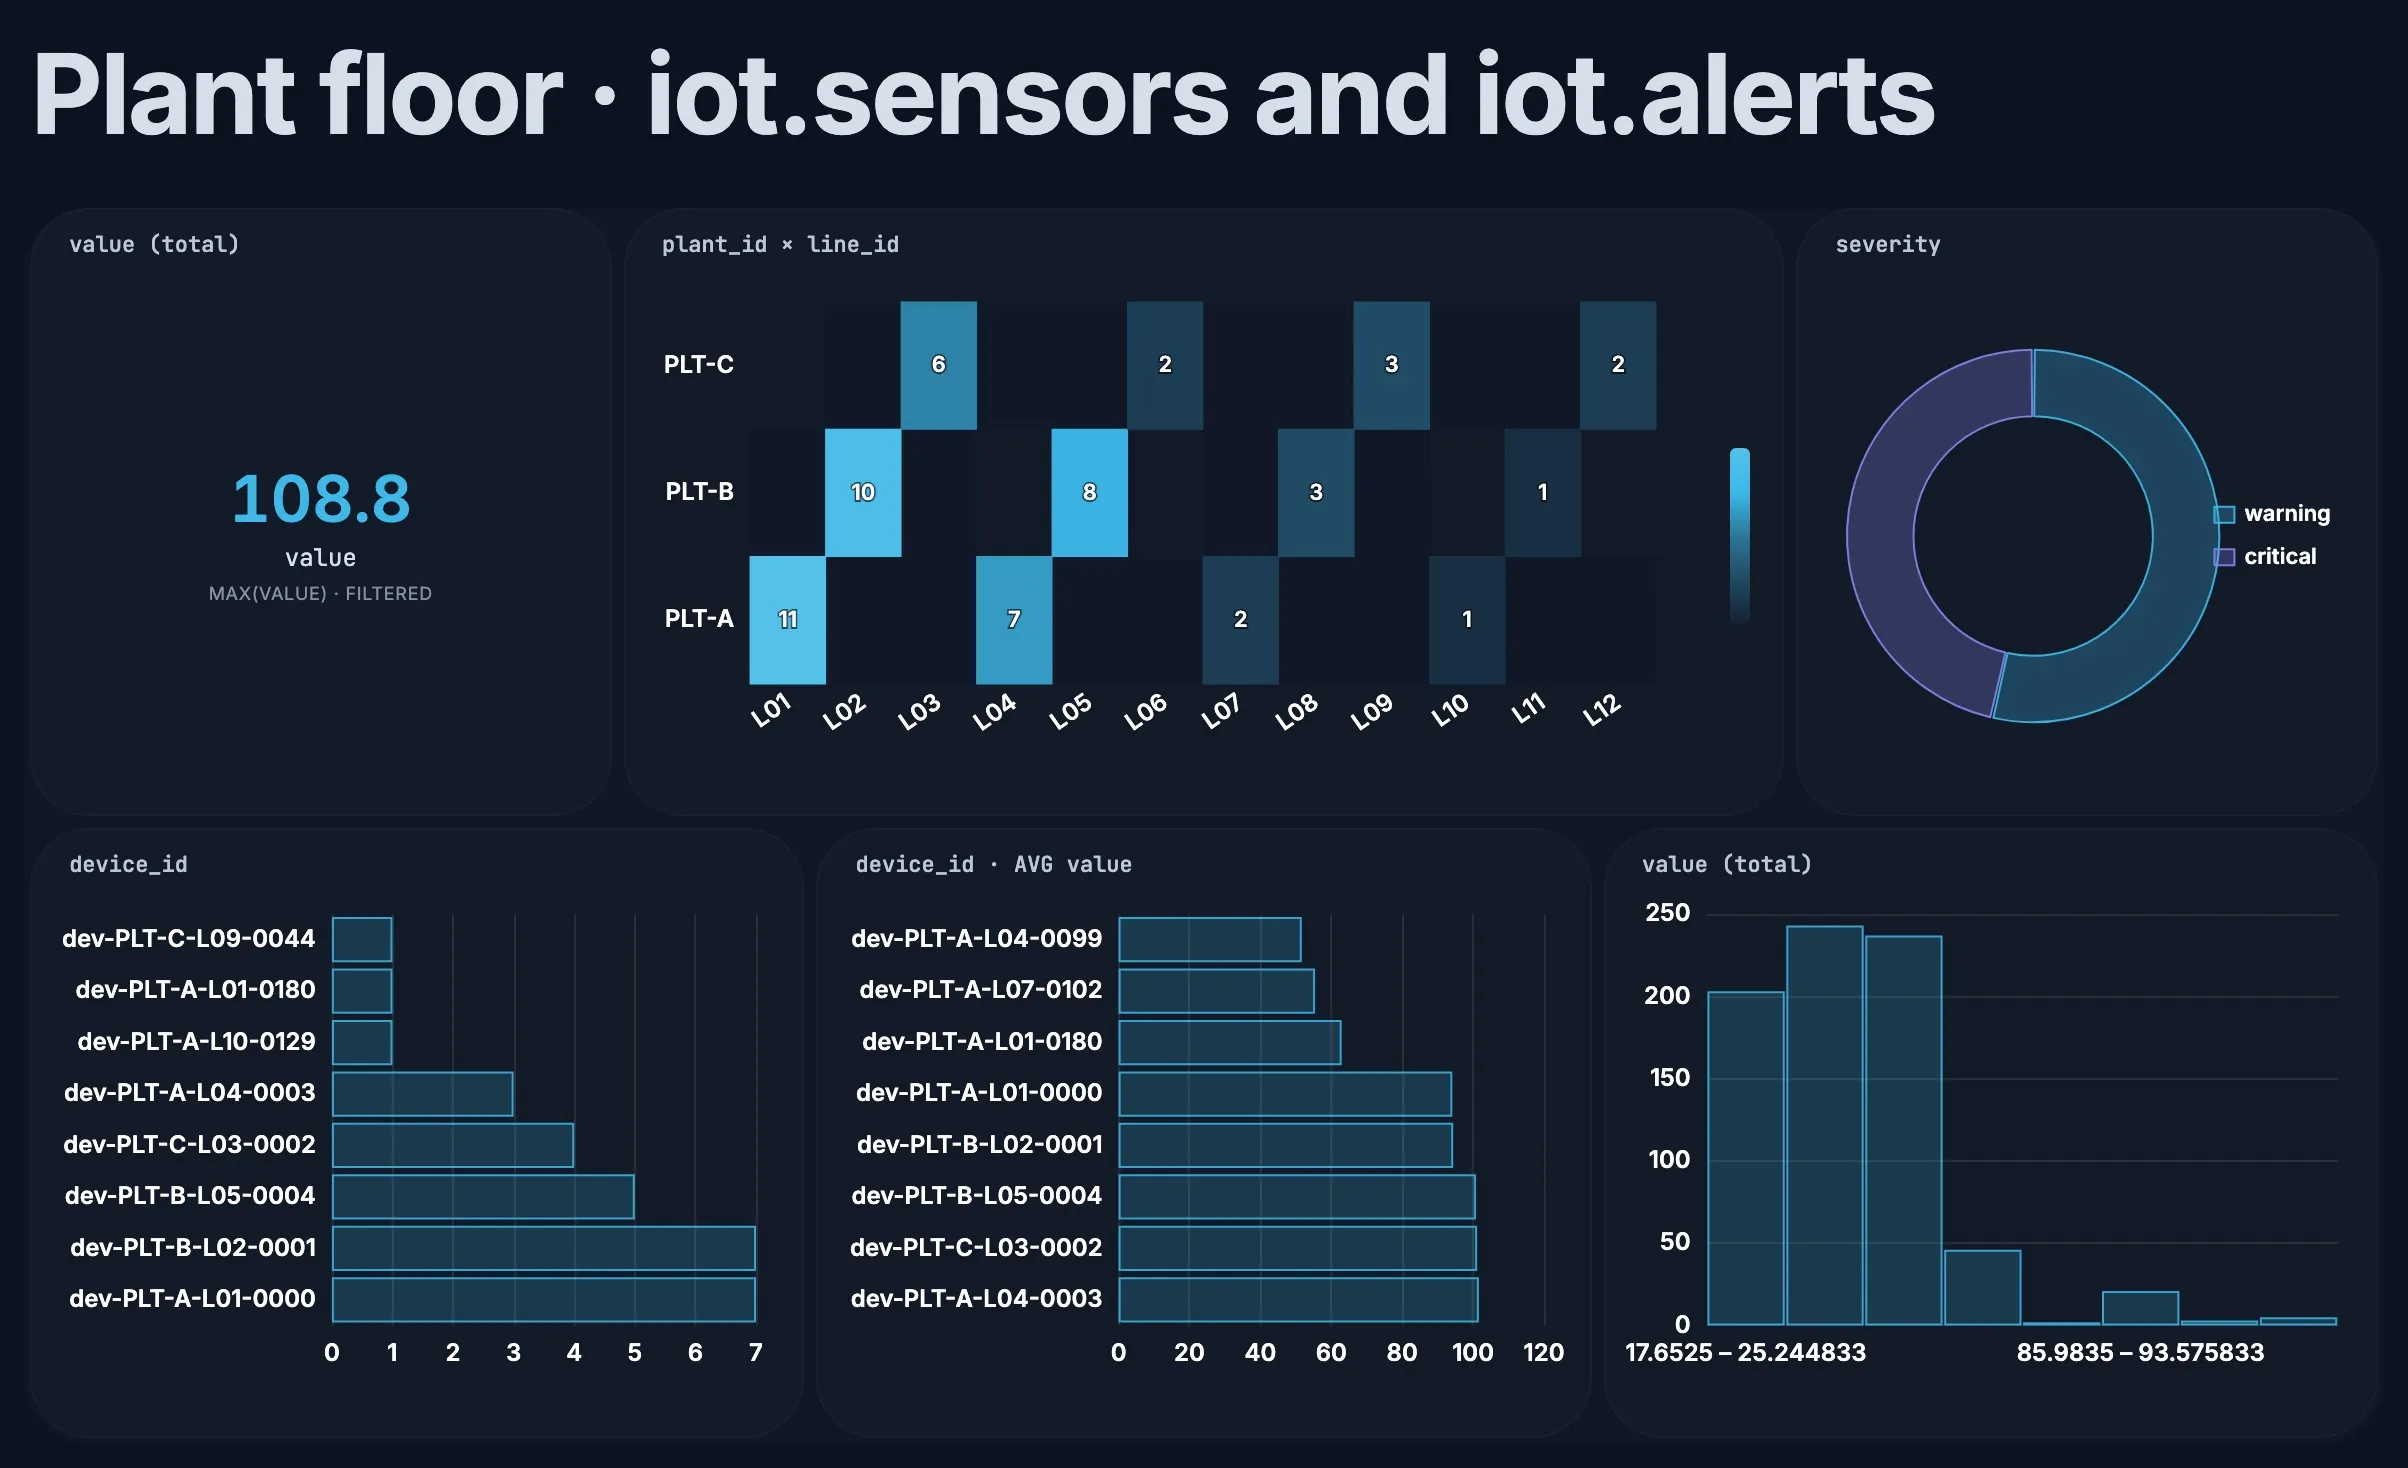
Add a text block with the plant’s name, group the cards in a container, and turn on Live. Present shows the board full screen for a wall screen on the floor; choose Clean to hide the card tools. See Explore and charts.
4. Check fleet health with a playbook
Section titled “4. Check fleet health with a playbook”In Explore, choose Playbook, add a playbook, and add these queries with + SQL. Explore creates a view for each topic, such as v_iot_sensors.
In SQL, a payload field named value is a column called value_2 in the views, because value is already the raw message. The queries below read it from the payload instead, with payload->>'$.value'.
Noisy devices: machines with the most alerts, and their share of all alerts.
SELECT device_id, COUNT(*) AS alerts, COUNT(*) FILTER (WHERE severity = 'critical') AS critical, round(100.0 * COUNT(*) / SUM(COUNT(*)) OVER (), 1) AS pct_of_alertsFROM v_iot_alertsGROUP BY 1ORDER BY alerts DESCLIMIT 10Missed alerts: readings over a threshold with no matching alert. This checks the alerting service, so it should return no rows.
SELECT s.device_id, s.metric_name, CAST(s.payload->>'$.value' AS DOUBLE) AS valueFROM v_iot_sensors sWHERE ((s.metric_name = 'iot.temp_c' AND CAST(s.payload->>'$.value' AS DOUBLE) >= 85) OR (s.metric_name = 'iot.vibration_g' AND CAST(s.payload->>'$.value' AS DOUBLE) >= 4.5)) AND NOT EXISTS ( SELECT 1 FROM v_iot_alerts a WHERE a.device_id = s.device_id AND a.metric_name = s.metric_name AND (a.payload->>'$.value') = (s.payload->>'$.value'))Hottest devices: average and peak temperature per machine, with its firmware.
SELECT device_id, firmware_version, COUNT(*) AS readings, round(AVG(CAST(payload->>'$.value' AS DOUBLE)), 1) AS avg_c, round(MAX(CAST(payload->>'$.value' AS DOUBLE)), 1) AS max_cFROM v_iot_sensorsWHERE metric_name = 'iot.temp_c'GROUP BY ALLORDER BY avg_c DESCLIMIT 10Unit mismatches: each metric should always use the same unit. A mismatch usually means a device or agent was misconfigured, and every chart of that metric is wrong.
SELECT payload->>'$.metric_name' AS metric_name, list(DISTINCT payload->>'$.unit') AS unitsFROM messagesWHERE topic IN ('metrics.host', 'metrics.http', 'iot.sensors')GROUP BY 1HAVING COUNT(DISTINCT payload->>'$.unit') > 1Alert rate: alerts per 100 readings, to compare with yesterday or another plant.
SELECT (SELECT COUNT(*) FROM v_iot_alerts) AS alerts, (SELECT COUNT(*) FROM v_iot_sensors) AS readings, round(100.0 * (SELECT COUNT(*) FROM v_iot_alerts) / (SELECT COUNT(*) FROM v_iot_sensors), 2) AS alerts_per_100Choose Run all. Missed alerts and Unit mismatches returned no rows: every reading over a threshold had its alert. There were 56 alerts for 2,953 sensor readings, 1.9 per 100.
Noisy devices showed where they came from: 5 machines, 2% of the fleet, sent 26 of the 56 alerts, all of them critical. Every other machine sent at most one. Hottest devices put the same 5 machines at the top, averaging 94 to 102 °C against a normal 18 to 42.
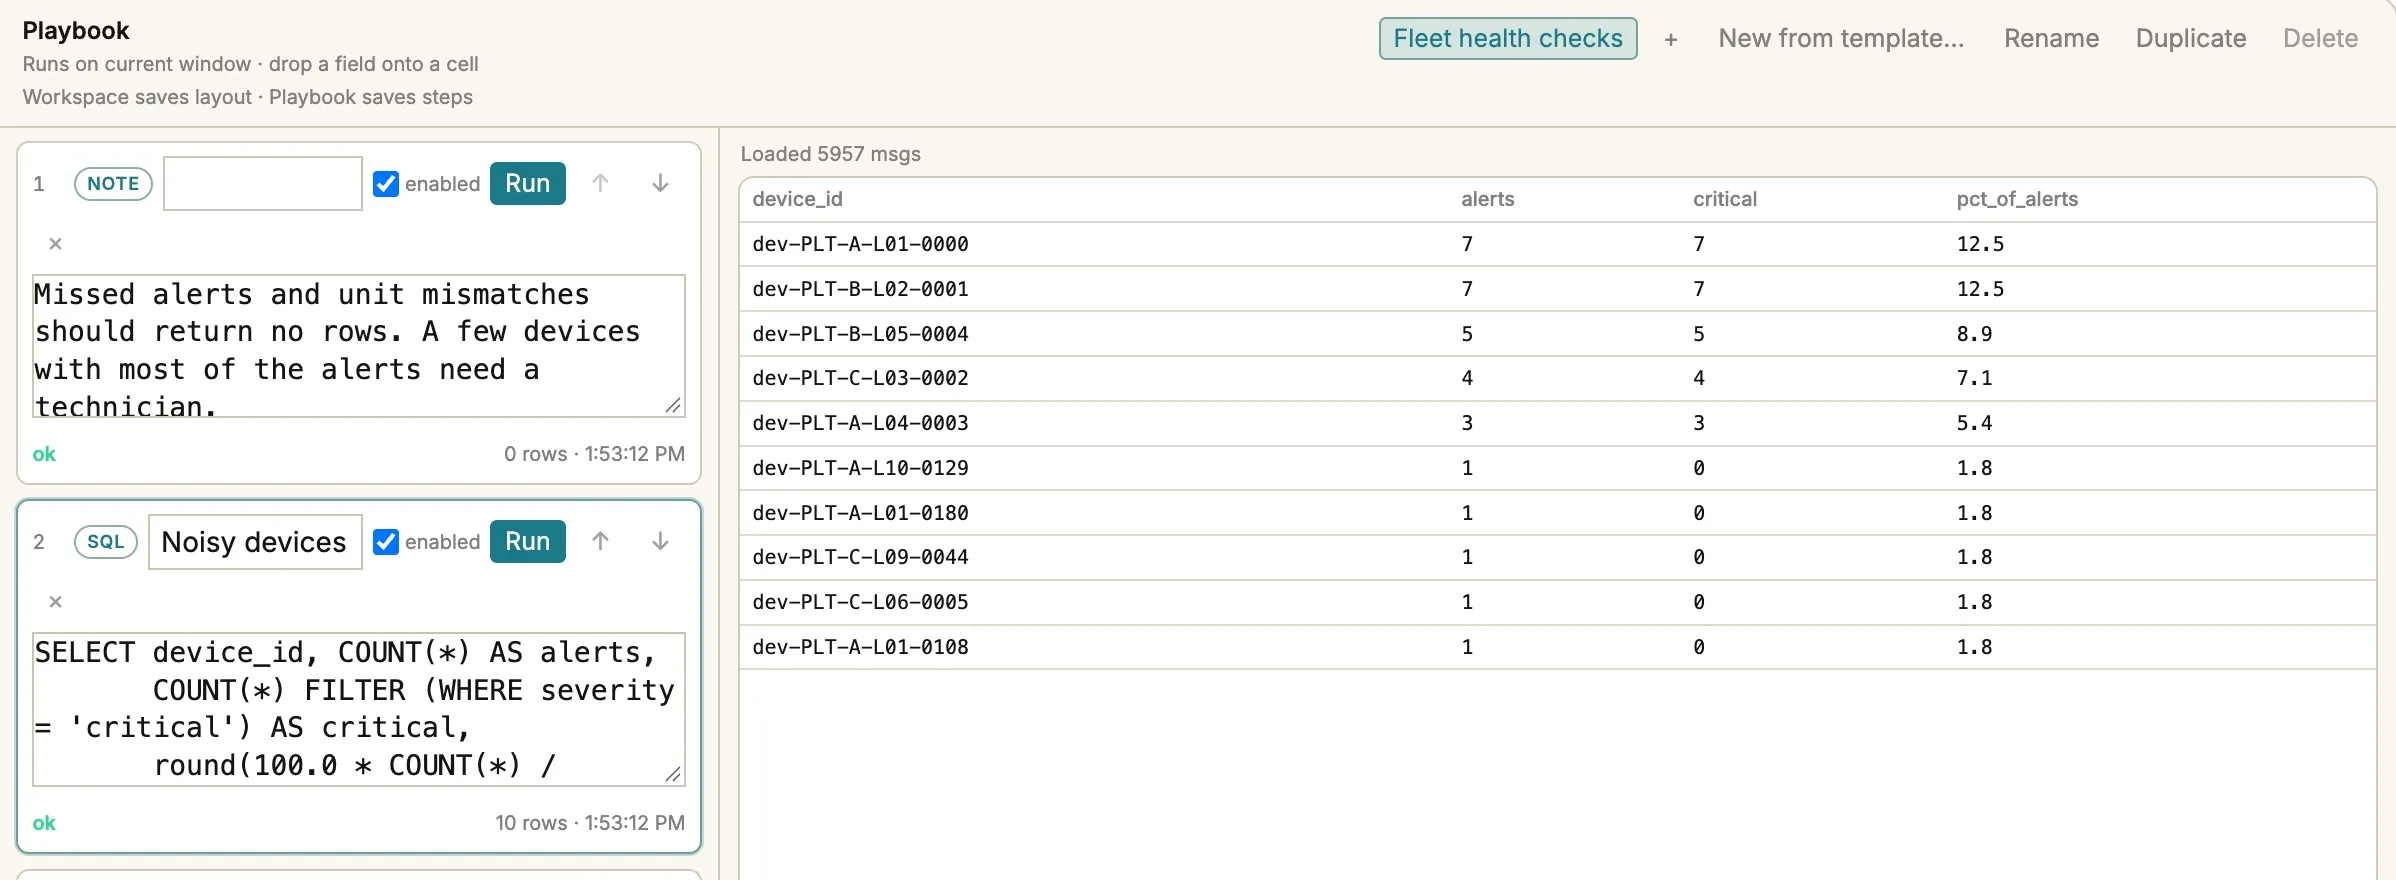
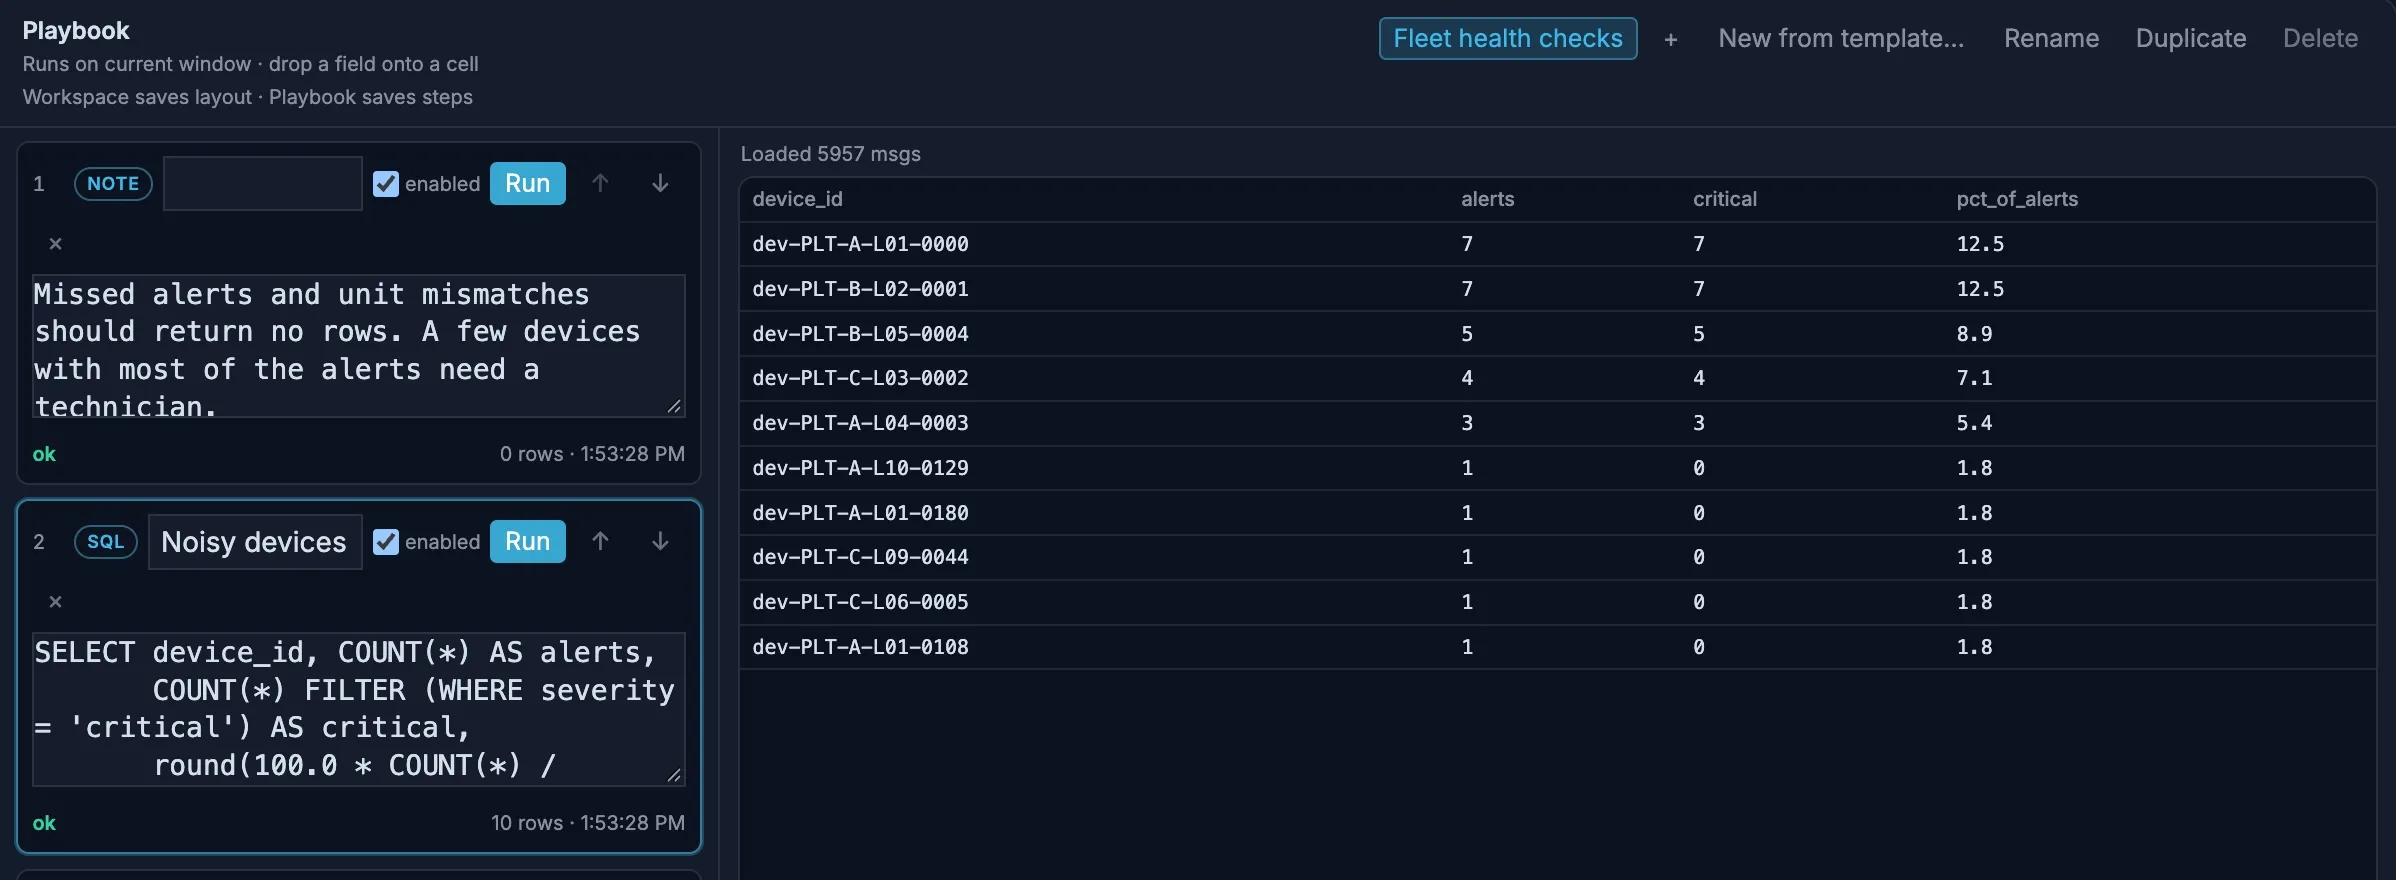
Concentrated alerts like these usually mean a few failing machines, not a fleet-wide problem. Check the Hottest devices firmware column too: if the top machines share a firmware version, the problem may be the update, not the hardware.
Next steps
Section titled “Next steps”- Compare servers and services:
metrics.hostandmetrics.httpsharehost_id, so you can join a host’s CPU with the latency of the services on it. - Keep more history for trends: raise Explore rings in Settings.