

Quickstart
This walkthrough uses a small file of shop orders instead of a Kafka cluster, so you can try the whole loop in about five minutes: watch messages arrive, trap the ones that matter, and chart them. Everything you do here works the same way on a live topic.
You need Akema running and open in your browser. If it isn’t yet, follow Install Akema first.
1. Download the sample file
Section titled “1. Download the sample file”Download quickstart-orders.csv (44 KB). It holds 600 orders from about an hour of trading, one per row:
order_id,timestamp,customer_id,country,channel,payment_method,status,items,total_usd,couponORD-100001,2026-10-20T14:00:06.451Z,C01800,NL,web,card,paid,2,94.18,Most orders are paid. Somewhere in the hour, a run of payments started failing.
2. Load it as a stream
Section titled “2. Load it as a stream”- Open the Connect tab and choose Load Fixture. A new column appears in the Fixtures table.
- Set Name to
Demo ordersand Topic toorders. - Under File, choose
quickstart-orders.csv. - Open Inject, set Mode to Pace (rows / sec) and leave Rows / sec at
20, so the file plays like a live topic. - Choose Load.
The column changes to Live, and the count climbs to 600 over about 30 seconds.
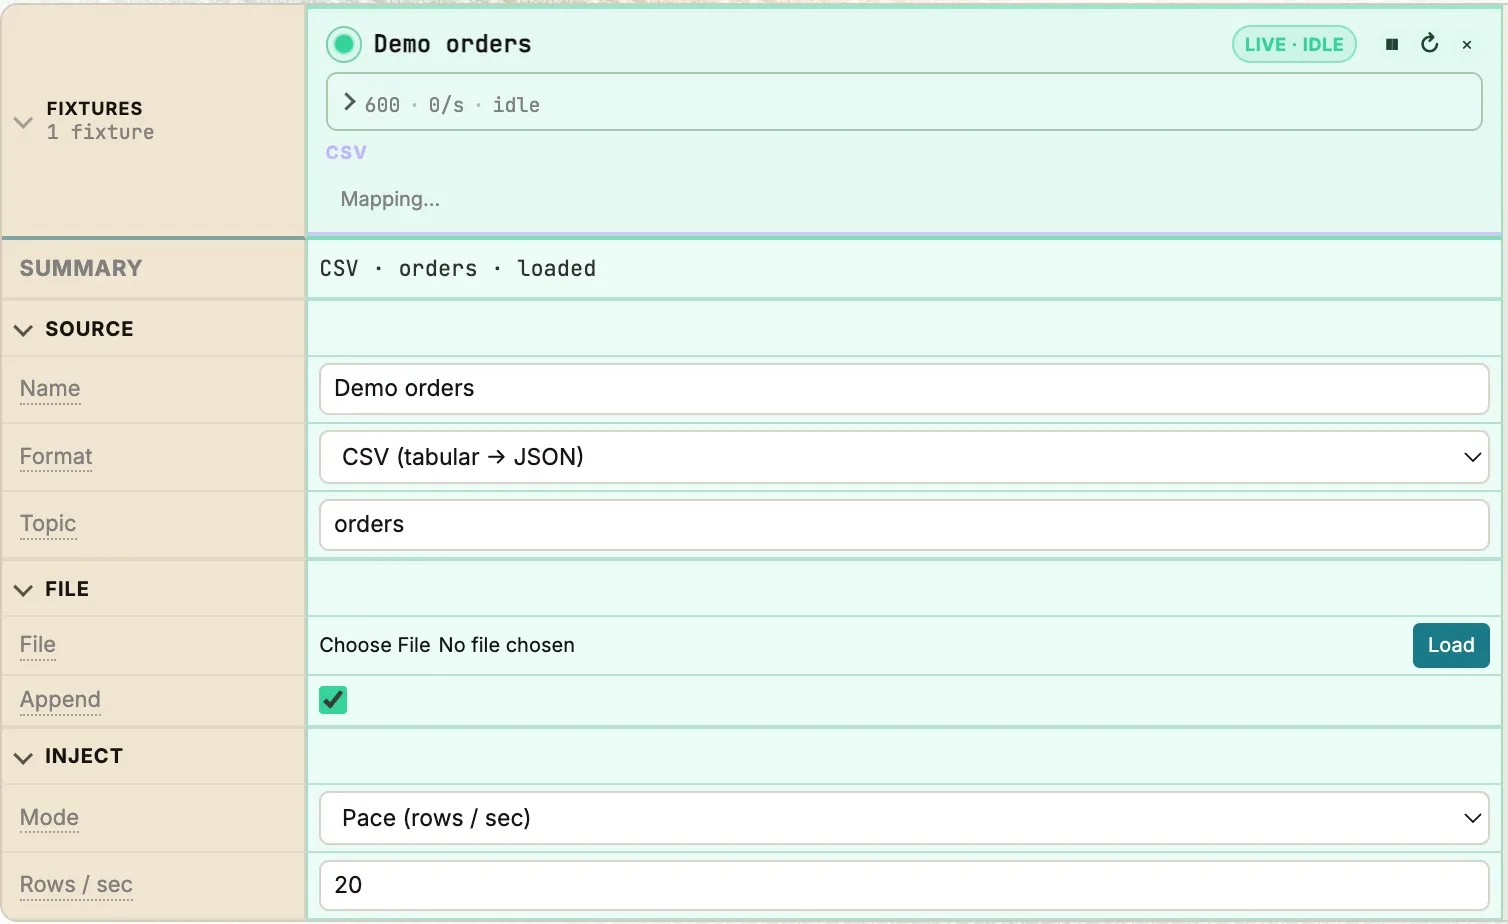
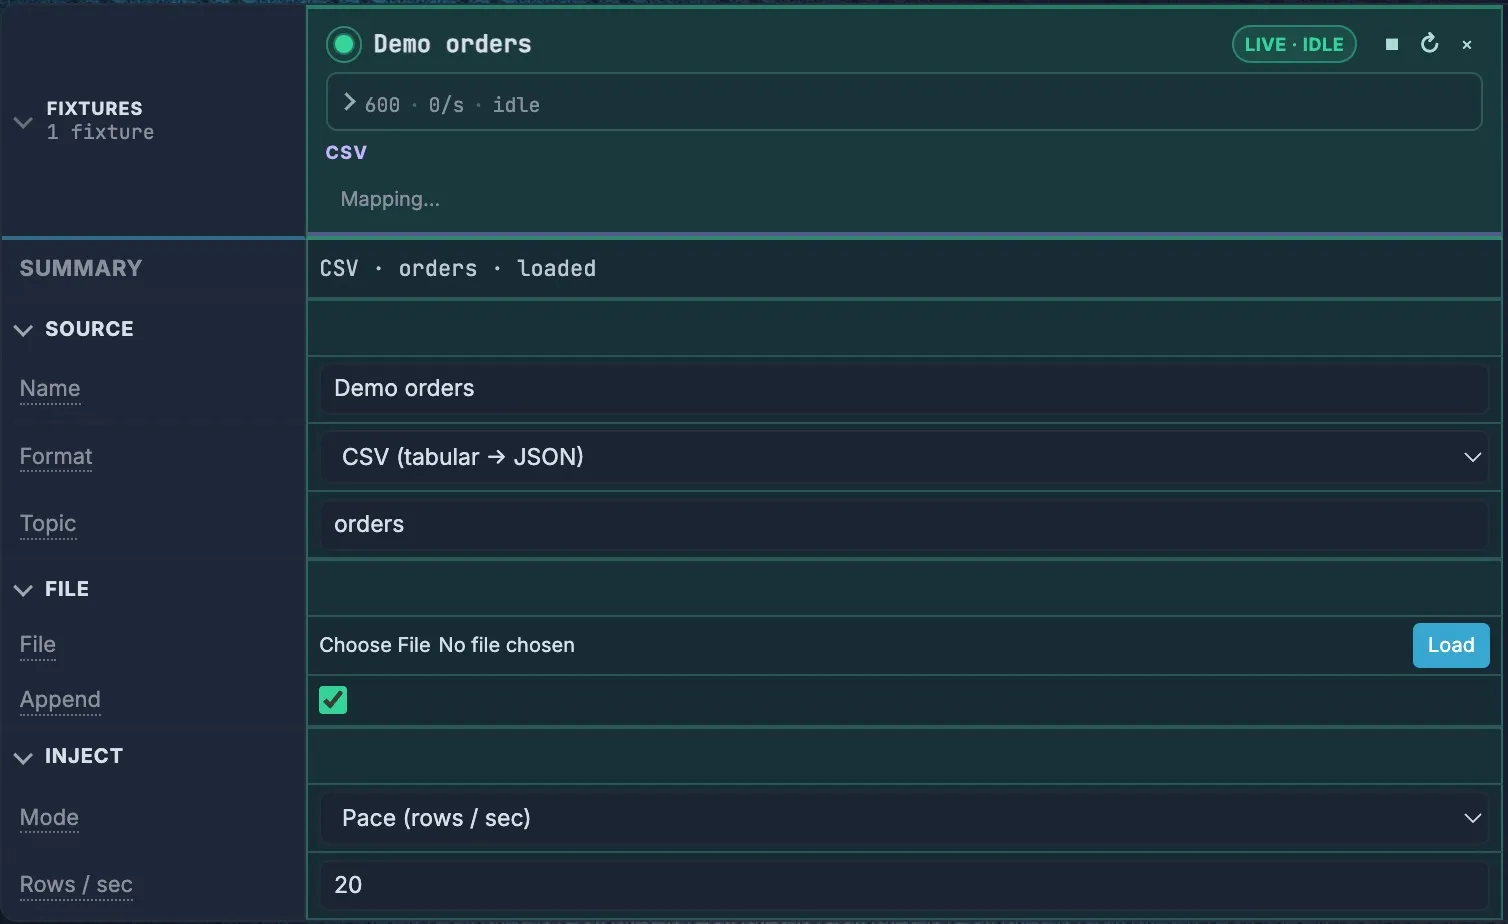
Akema turns each CSV row into a JSON message. Numbers stay numbers, and the timestamp column becomes the message time. (A column named key would become the message key; Mapping… lets you pick other columns.)
3. Watch the messages
Section titled “3. Watch the messages”Open Inspect. Rows appear in the live table as they’re read, newest at the bottom. Select any row to open it in the Record pane on the right, where the message shows as a tree of fields.
Every field in that tree has three actions: Trap starts a rule from its value, Explore charts it, and Pluck adds it as a column in the table.
4. Catch failed payments with a trap
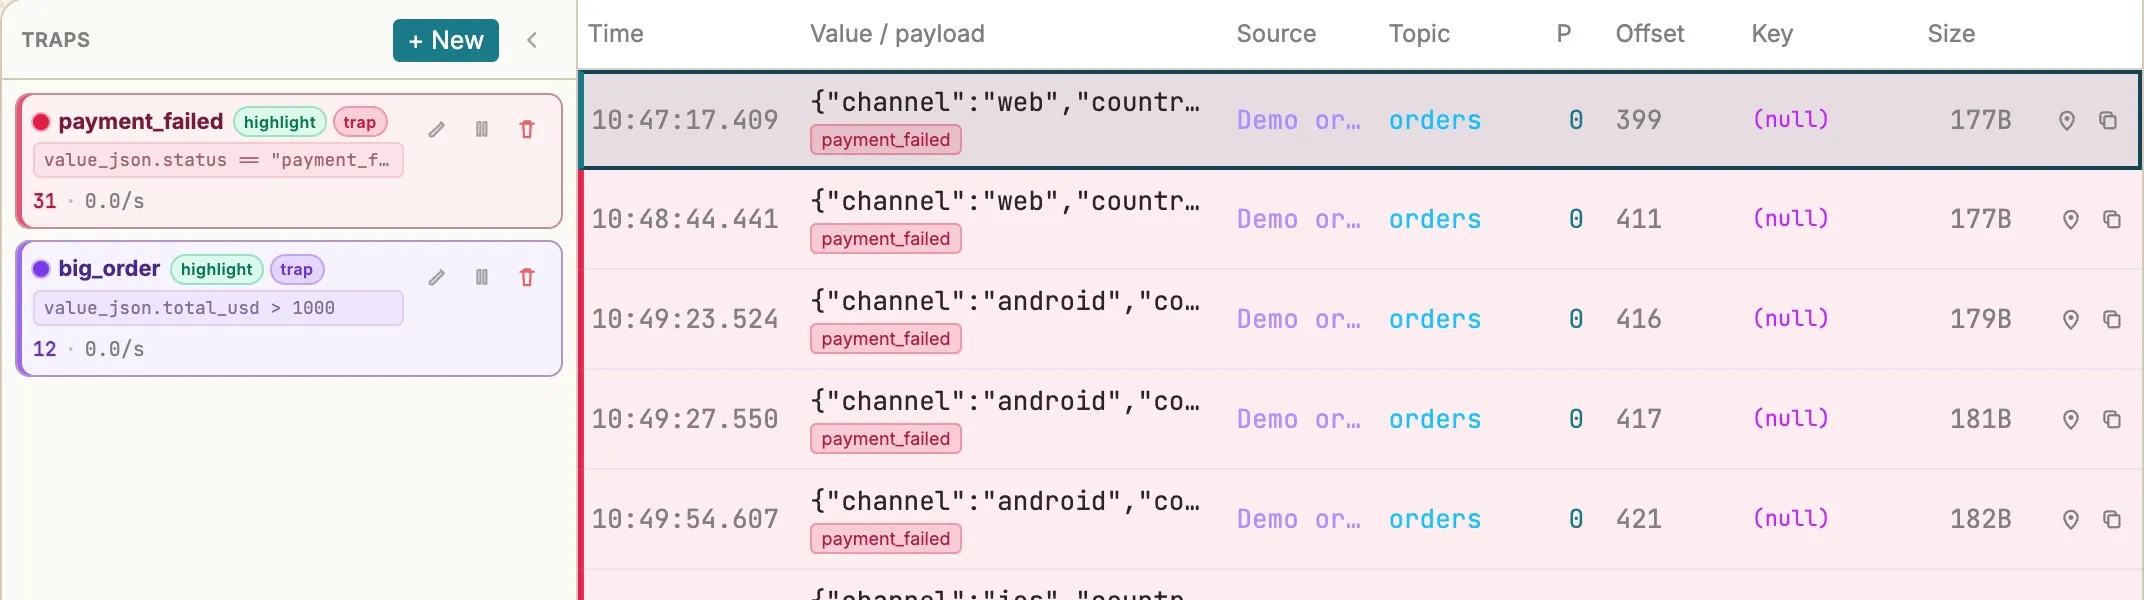
Section titled “4. Catch failed payments with a trap”A trap is a CEL expression that Akema checks against every message as it arrives. Matching rows are tagged and counted. Traps and CEL covers them in depth.
-
In the Traps panel, choose + New.
-
Choose Advanced CEL.
-
Name the trap
payment_failedand enter:value_json.status == "payment_failed" -
Pick a color and choose Save trap.
Add a second trap the same way, named big_order:
value_json.total_usd > 1000value_json is the message value parsed as JSON. Other things you can match on include key, headers, topic, partition, offset and timestamp.
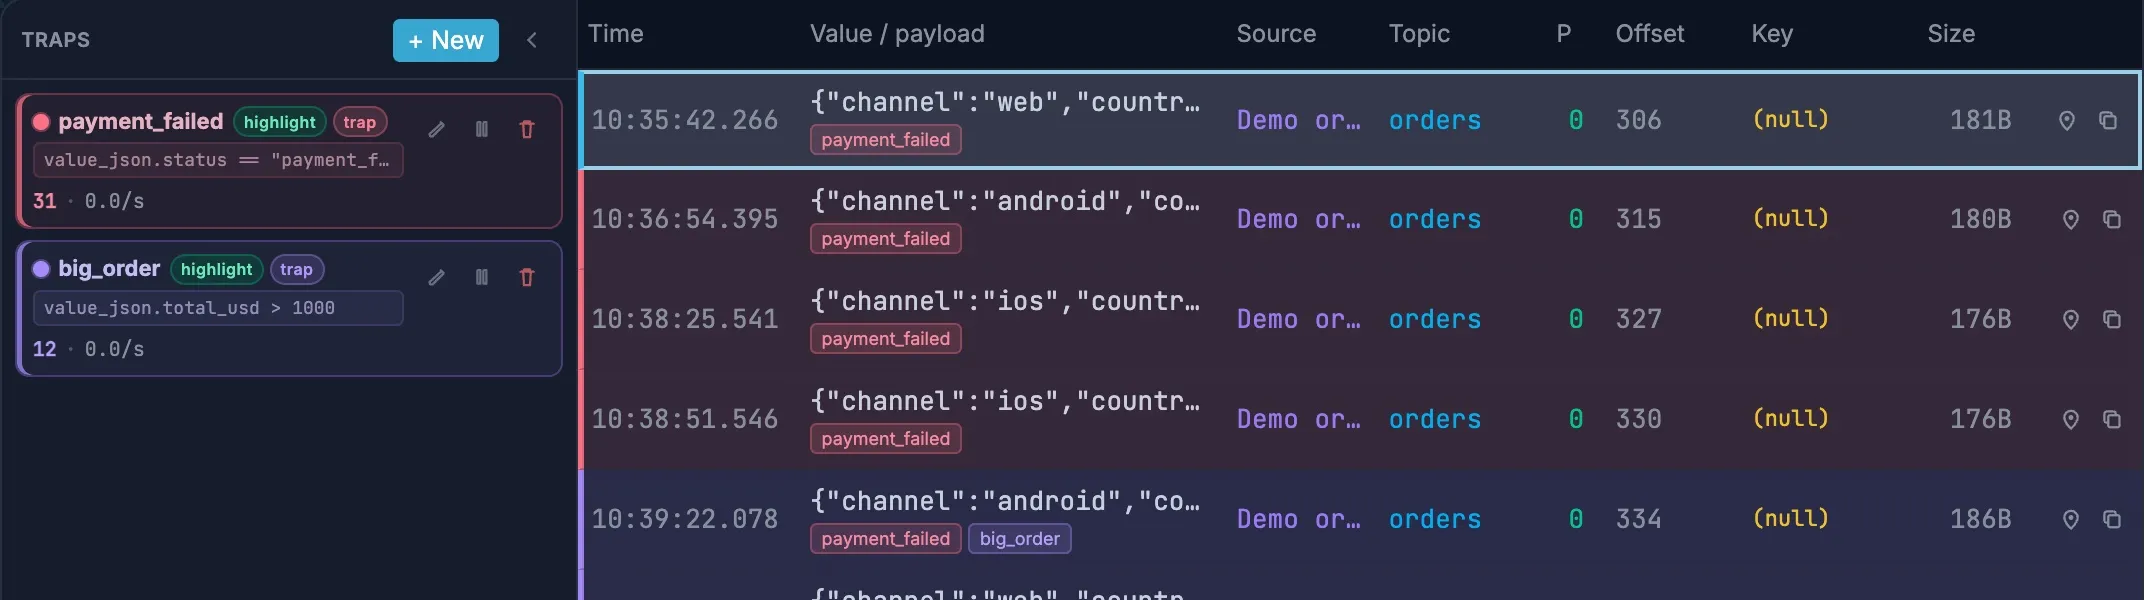
Traps only see messages that arrive after you save them. The file has already finished, so replay it: choose ↻ on the Demo orders pill above the table. The replay runs at full speed, and the counters settle at 31 failed payments and 12 orders over $1,000.
To see only the matches, turn on Traps only at the bottom of the Traps panel. The Trap Flow chart under the table shows how the stream splits between your traps.
5. Chart it in Explore
Section titled “5. Chart it in Explore”Explore loads a snapshot of recent messages into a database that runs inside your browser, so you can slice them without setting up a warehouse.
- Open Explore and choose Load. The Fields list fills with what Akema found in the messages: fields to group by under Payload, and numbers to add up, like
total_usd, under Measures. - Drag
statusonto the canvas. You get a chart counting orders by status. - Drag
payment_methodonto the canvas next to it. - In the
statuschart, click thepayment_failedslice.
That click adds a filter, and every other chart follows it. With the filter on, the payment_method chart shows that PayPal has the most failed payments, 12 of 31, even though only about one order in five is paid with PayPal. That’s the run of failures hidden in the file.
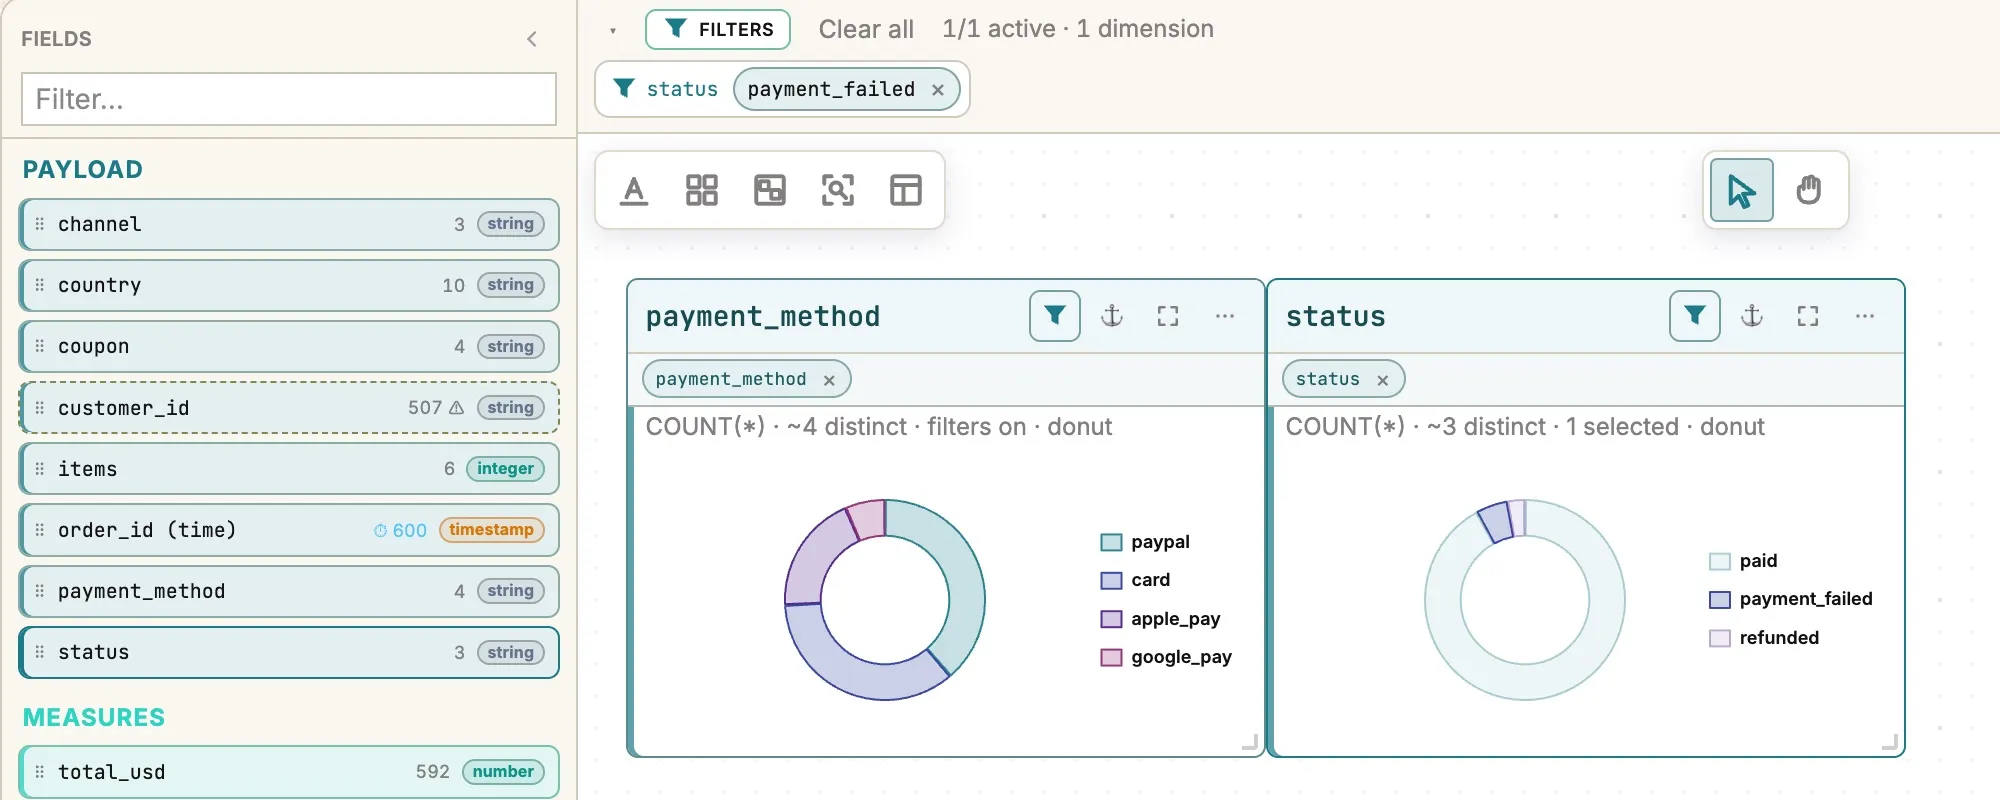
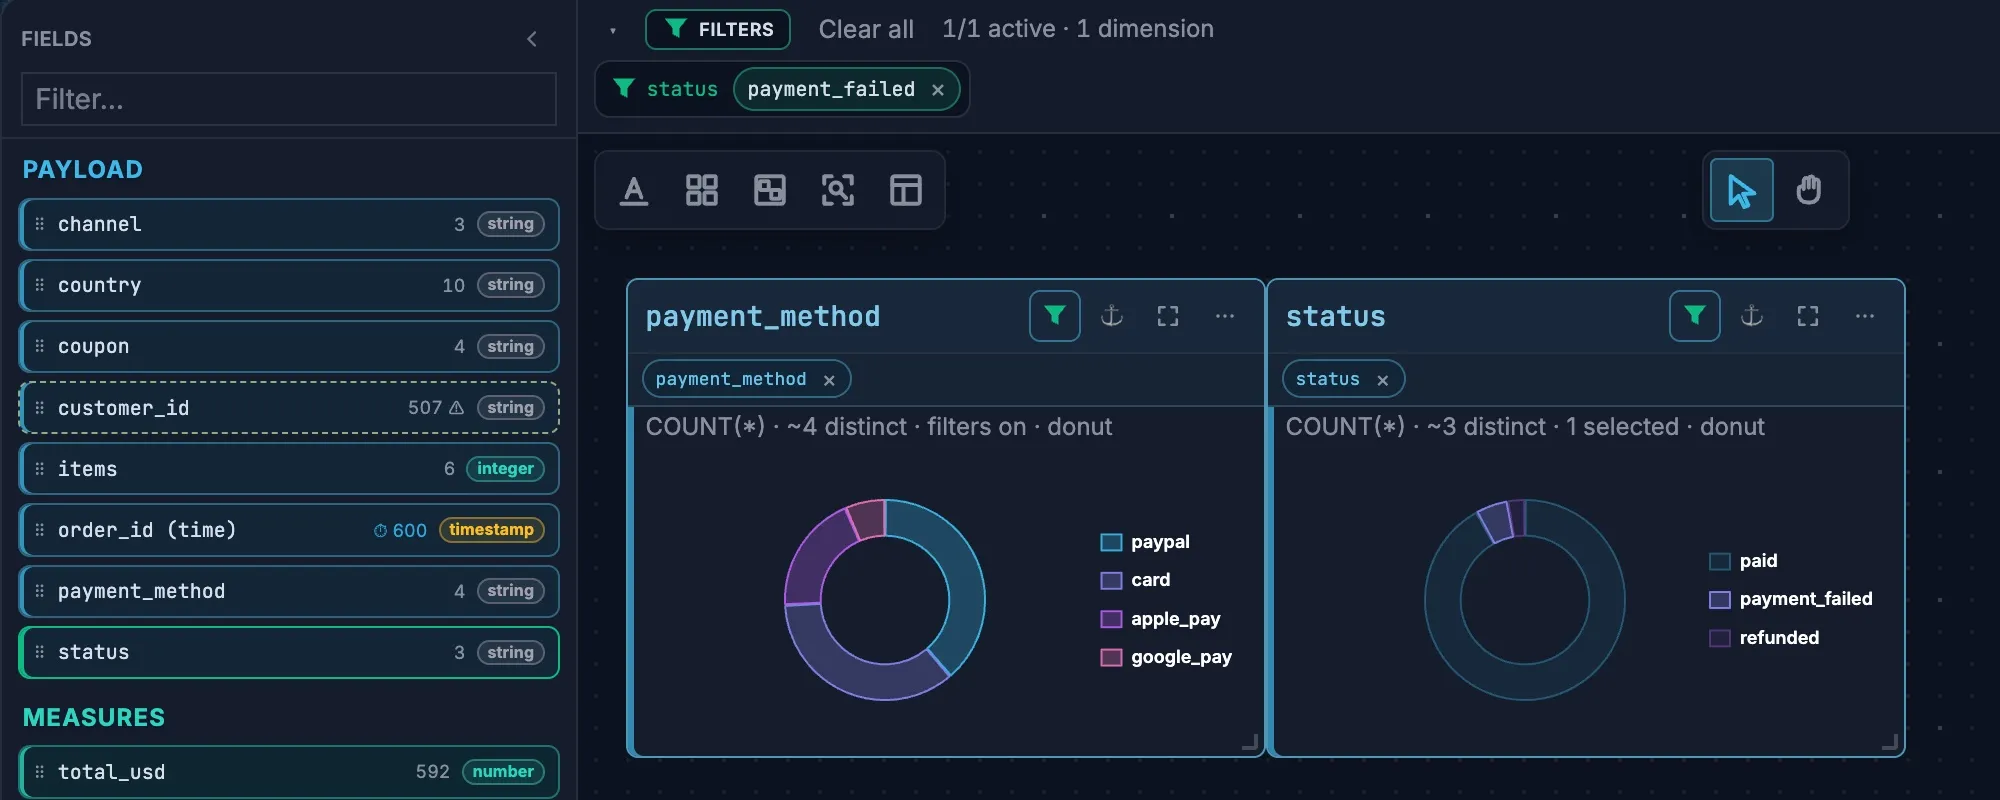
Click the slice again to remove the filter. To chart a sum instead of a count, drop a measure such as total_usd onto a chart. Explore and charts covers the rest.
What’s next
Section titled “What’s next”- Tutorial. Do the same on a real Kafka broker in Docker, with a shop script that has problems for you to find.
- Connect to Kafka. Add a source on the Connect tab with Add Source. Traps, Inspect and Explore work the same on live topics.
- Keep your setup. Traps, connections and canvas layouts are saved with the workspace. Message content never is: when Akema restarts, it reads the data again from Kafka or the file.
- Use your own files. Any CSV with a header row works, as do JSON and NDJSON dumps (including
kcat -Joutput), up to 64 MB.